A reader has pointed out that we can also use the data collected in our Eratosthenes experiment to test the hypothesis that the Earth is flat and that the difference in shadows is caused by the sun being a relatively small distance from the flat Earth. And we can compare this test to a test of our round Earth hypothesis.
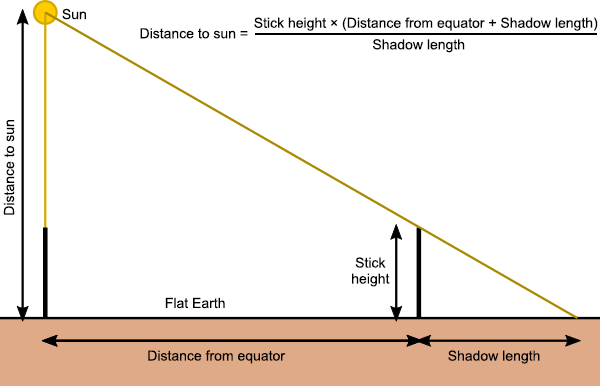
If the Earth is flat, and we make an observation like Eratosthenes, that a vertical stick in one location casts no shadow, while a vertical stick some distance north (or south) does cast a shadow, then we can use geometry to figure out how far away the sun must be.

If the Earth is indeed flat then when we do this calculation for each of our 19 observations we should get the same answer, to within any experimental error. In particular, there should be no systematic difference in our answers that depends on the distance from the equator. Analogously, in our round Earth model, the circumference we have calculated for the Earth from each of our observations should also be the same to within experimental errors, and show no systematic difference depending on distance from the equator.
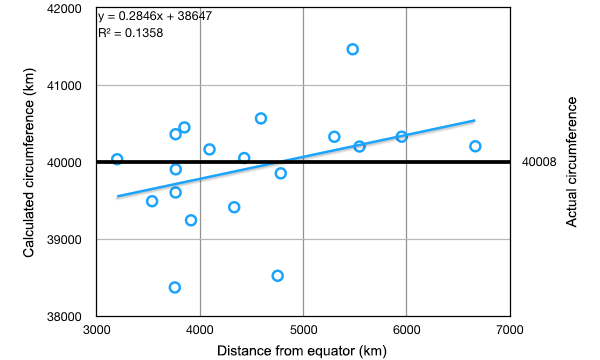
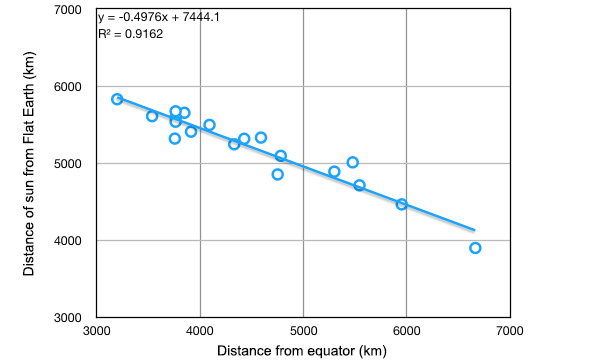
So let’s test those things! Here are graphs of the results, on which I’ve included a linear least squares best fit line, showing the line’s equation and statistical R2 score. The R2 value, or coefficient of determination, is a measure of how likely the data values (the circumference of the Earth in the round Earth hypothesis, or the distance to the sun in the flat Earth hypothesis) are to be correlated with the fixed values (the distance from the equator in both cases). We’ll discuss that after we see the data.


The first thing to notice is that in the top plot, the circumference of the Earth values look fairly evenly scattered around the true value. In the bottom plot, the calculated values for the distance of the sun from Earth are not evenly scattered; they show a pretty clear trend of giving larger distances for the data points closer to the equator and smaller distances for data points further from the equator. We can quantify this by looking at the straight line fits to the data and in particular the R2 value.
To do a rigorous statistical test, we need to set up our two possible null hypotheses. These are statements that for the purpose of our statistical test we assume are true, and then we calculate the probability that what we observe could happen by random chance. Our two null hypotheses are:
1. For the spherical Earth model, the calculated circumference of Earth is independent of the distance from the equator of our data points.
2. For the flat Earth model, the calculated distance of the sun from Earth is independent of the distance from the equator of our data points.
To test these, we use a probability distribution that tells us how likely our observed R2 scores are. An appropriate one to use is Student’s t-distribution. We calculate Student’s t-distribution function for 19 data points and 2 degrees of freedom (the y-intercept and the slope of our fitted line), determine a value for the function below which 95% of the probability distribution lies, and convert this to an R2 value using the known transformation. In simpler terms (TL;DR), we’re working out a number R2(P<0.05) which, if our calculated values are independent of distance from the equator, then we would expect 95% of experiments to give an R2 value less than the number R2(P<0.05).
Doing the maths, our value for R2(P<0.05) is 0.334. What this means is that if our R2 value is greater than 0.334, then we should reject our null hypothesis – the data are statistically inconsistent with the hypothesis (at the 95% confidence level, for those who like statistical rigour*). On the other hand, if our R2 value is less than 0.334, we cannot reject our null hypothesis – we haven’t proven it to be true, we have just shown that our data are consistent with it.
Now let’s look at our calculated R2 values. For the spherical Earth hypothesis, R2 = 0.1358. This is less than the critical value, so our data are consistent with our hypothesis. In contrast, for the flat Earth model, R2 = 0.9162. This is greater than the critical value, so we can confidently reject the flat Earth hypothesis as inconsistent with our experiment!
So there you have it. Not only did we successfully measure the circumference of the Earth to within our experimental errors, we have now also shown that our experimental results are consistent with a spherical Earth model, and inconsistent with a flat Earth model.
* Note: Choosing the 95% confidence level is typical for statistical hypothesis testing. You should always choose your confidence level before performing the calculations, to avoid any bias in your reporting. You can choose other levels, such as 99%. If I’d done that, we would have found that our data are also inconsistent with the flat Earth model at the more stringent 99% confidence level. In fact, calculating backwards, the confidence level of our rejection is a bit above 99.7%.
Also, a distance to the Sun of only around 5000 km would probably cause some other issues
I don’t know, 5000 km sounds about right.*
*disclaimer: I live in Australia, which as we all know is literally** 5000 km from the sun, which is why it’s so stinkin’ hot down under.
**literally here being used in the figurative sense, of course.
Remember that our major source of information about the sun’s size is it’s appearant extent and the distance estimate (for a long time, this was the only good information available), thus a close sun is a small sun. One would assume that were the sun only 5,000 km away, it would be about 44 km in diameter and would not heat the Earth excessively.
You have to remember, if you’re rejecting the round Earth hypothesis in favor of a flat-Earth hypothesis, a lot of the rest of what you think you know goes with the round Earth.
What issues? If the sun is only that far, it is also a lot smaller than the standard model states. The effects should balance out, so that the light and heat from the sun depends pretty much just on the apparent angular size and the surface temperature.
You’d need major modifications to the physics of how the sun generates its heat, however.
Apparent angular size is going to vary a lot depending distance from the point directly beneath the sun. One the equinox, the sun is directly above a point on the equator (verifiable by direct observation), the sun is at the horizon as seen from the North pole (verifiable by direct observation). The sun appears to have an angular size of 0.5° (verfiable by direct observation) we will take that WLOG as the equator measurement. At the North pole, the sun would be (Sqrt(5000² + 10000²) 11,180km away and thus have a angular size of (arctan(tan(0.5)*5000)*11,180) 0.22 degrees. Easily measurable. And, of course, it would vary continuously for any distance from the equator.