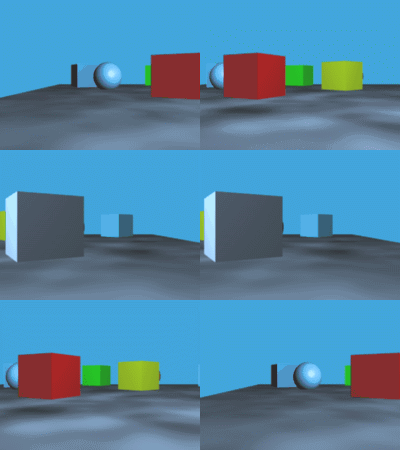
We see the world in 3D. What this means is that our visual system—comprising the eyes, optic nerves, and brain—takes the sensory input from our eyes and interprets it in a way that gives us the sensation that we exist in a three-dimensional world. This sensation is often called depth perception.
In practical terms, depth perception means that we are good at estimating the relative distances from ourselves to objects in our field of vision. You can tell if an object is nearer or further away just by looking at it (weird cases like optical illusions aside). A corollary of this is that you can tell the three-dimensional shape of an object just by looking at it (again, optical illusions aside). A basketball looks like a sphere, not like a flat circle. You can tell if a surface that you see is curved or flat.
To do this, our brain relies on various elements of visual data known as depth cues. The best known depth cue is stereopsis, which is interpreting the different views of left and right eyes caused by the parallax effect, your brain innately using this information to triangulate distances. You can easily observe parallax by looking at something in the distance, holding up a finger at arms length, and alternately closing left and right eyes. In the view from each eye, your finger appears to move left/right relative to the background. And with both eyes open, if you focus on the background, you see two images of your finger. This tells your brain that your finger is much closer than the background.
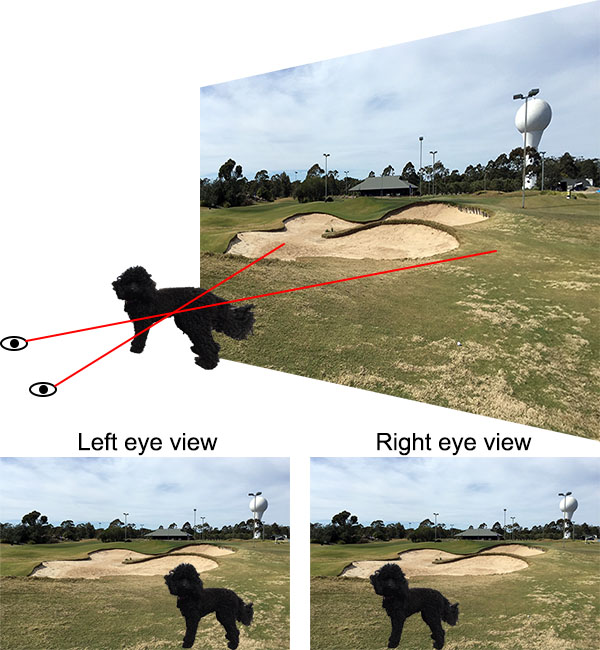
We’ll discuss stereopsis in more detail below, but first it’s interesting to know that stereopsis is not the only depth cue our brains use. There are many physically different depth cues, and most of them work even with a single eye.
Cover one eye and look at the objects nearby, such as on your desk. Reach out and try to touch them gently with a fingertip, as a test for how well you can judge their depth. For objects within an easy hand’s reach you can probably do pretty well; for objects you need to stretch to touch you might do a little worse, but possibly not as bad as you thought you might. The one eye that you have looking at nearby things needs to adjust the focus of its lens in order to keep the image focused on the retina. Muscles in your eye squeeze the lens to change its shape, thus adjusting the focus. Nerves send these muscle signals to your brain, which subconsciously uses them to help gauge distance to the object. This depth cue is known as accommodation, and is most accurate within a metre or two, because it is within this range that the greatest lens adjustments need to be made.
With one eye covered, look at objects further away, such as across the room. You can tell that some objects are closer and other objects further away (although you may have trouble judging the distances as accurately as if you used both eyes). Various cues are used to do this, including:
Perspective: Many objects in our lives have straight edges, and we use the convergence of straight lines in visual perspective to help judge distances.
Relative sizes: Objects that look smaller are (usually) further away. This is more reliable if we know from experience that certain objects are the same size in reality.
Occultation: Objects partially hidden behind other objects are further away. It seems obvious, but it’s certainly a cue that our brain uses to decide which object is nearer and which further away.
Texture: The texture on an object is more easily discernible when it is nearer.
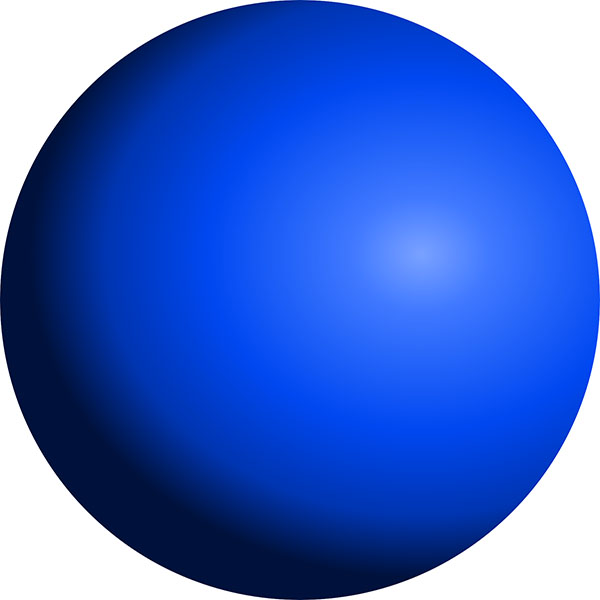
Light and shadow: The interplay of light direction and the shading of surfaces provides cues. A featureless sphere such as a cue ball still looks like a sphere rather than a flat disc because of the gradual change in shading across the surface.
Motion parallax: With one eye covered, look at an object 2 or 3 metres away. You have some perception of its distance and shape from the above-mentioned cues, but not as much as if both your eyes were open. Now move your head from side to side. The addition of motion produces parallax effects as your eye moves and your brain integrates that information into its mental model of what you are seeing, which improves the depth perception. Pigeons, chickens, and some other birds have limited binocular vision due to their eyes being on the sides of their heads, and they use motion parallax to judge distances, which is why they bob their heads around so much.
There are some other depth cues that work with a single eye as well – I don’t want to try to be exhaustive here.
If you uncover both eyes and look at the world around you, your sense of three dimensionality becomes stronger. Now instead of needing motion parallax, you get parallax effects simply by looking with two eyes in different positions. Stereopsis is one of the most powerful depth cues we have, and it can often be used to override or trick the other cues, giving us a sense of three-dimensionality where none exists. This is the principle behind 3D movies, as well as 3D images printed on flat paper or displayed on a flat screen. The trick is to have one eye see one image, and the other eye see a slightly different image of the same scene, from an appropriate parallax viewpoint.
In modern 3D movies this is accomplished by projecting two images onto the screen simultaneously through two different polarising filters, with the planes of polarisation oriented at 90° to one another. The glasses we wear contain matched polarising filters: the left eye filter blocks the right eye projection while letting the left eye projection through, and vice versa for the right eye. The result is that we see two different images, one with each eye, and our brains combine them to produce the sensation of depth.
Another important binocular depth cue is convergence. To look at an object nearby, your eyes have to point inwards so they are both focused on the same point. For an object further away, your eyes look more parallel. Like your lenses, the muscles that control this send signals to your brain, which it interprets as a distance measure. Convergence can be a problem with 3D movies and images if the image creator is not careful. Although stereopsis can provide the illusion of depth, if it’s not also matched with convergence then there can be conflicting depth cues to your brain. Another factor is that accommodation tells you that all objects are at the distance of the display screen. The resulting disconnects between depth cues are what makes some people feel nauseated or headachy when viewing 3D images.
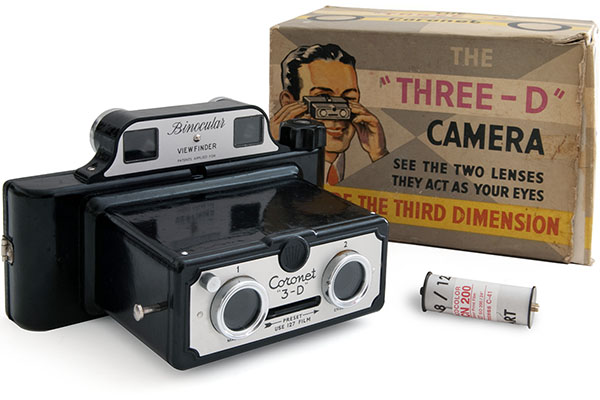
To create 3D images using stereopsis, you need to have two images of the same scene, as seen from different positions. One method is to have two cameras side by side. This can be used for video too, and is the method used for live 3D broadcasts, such as sports. Interestingly, however, this is not the most common method of making 3D movies.
3D movies are generally shot with a single camera, and then an artificial second image is made for each frame during the post-production phase. This is done by a skilled 3D artist, using software to model the depths to various objects in each shot, and then manipulate the pixels of the image by shifting them left or right by different amounts, and painting in any areas where pixel shifts leave blank pixels behind. The reason it’s done this way is that this gives the artist control over how extreme the stereo depth effect is, and this can be manipulated to make objects appear closer or further away than they were during shooting. It’s also necessary to match depth disparities of salient objects between scenes on either side of a scene cut, to avoid the jarring effect of the main character or other objects suddenly popping backwards and forwards across scene cuts. Finally, the depth disparity pixel shifts required for cinema projection are different to the ones required for home video on a TV screen, because of the different viewing geometries. So a high quality 3D Blu-ray of a movie will have different depth disparities to the cinematic release. Essentially, construction of the “second eye” image is a complex artistic and technical consideration of modern film making, which cannot simply be left to chance by shooting with two cameras at once. See “Nonlinear disparity mapping for stereoscopic 3D” by Lang et al.[1], for example, which discusses these issues in detail.
For a still photo however, shooting with two cameras at the same time is the best method. And for scientific shape measurement using stereographic imaging, two cameras taking real images is necessary. One application of this is satellite terrain mapping.
The French space agency CNES launched the SPOT 1 satellite in 1986 into a sun-synchronous polar orbit, meaning it orbits around the poles and maintains a constant angle to the sun, as the Earth rotates beneath it. This brought any point on the surface into the imaging field below the satellite every 26 days. SPOT 1 took multiple photos of areas of Earth in different orbital passes, from different locations in space. These images could then be analysed to match features and triangulate the distances to points on the terrain, essentially forming a stereoscopic image of the Earth’s surface. This reveals the height of topographic features: hills, mountains, and so on. SPOT 1 was the first satellite to produce directly imaged stereo altitude data for the Earth. It was later joined and replaced by SPOT 2 through 7, as well as similar imaging satellites launched by other countries.
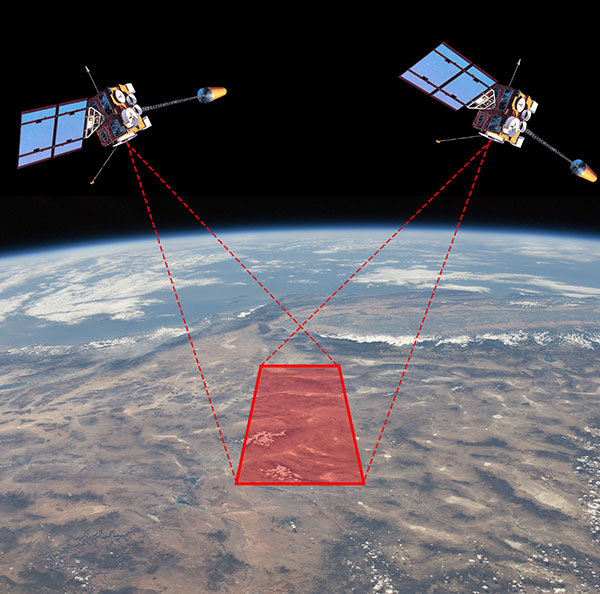
Now, if we’re taking photos of the Earth and using them to calculate altitude data, how important is the fact that the Earth is spherical? If you look at a small area, say a few city blocks, the curvature of the Earth is not readily apparent and you can treat the underlying terrain as flat, with modifications by strictly local topography, without significant error. But as you image larger areas, getting up to hundreds of kilometres, the 3D shape revealed by the stereo imaging consists of the local topography superimposed on a spherical surface, not on a flat plane. If you don’t account for the spherical baseline, you end up with progressively larger altitude errors as your imaged area increases.
A research paper on the mathematics of registering stereo satellite images to obtain altitude data includes the following passage[2]:
Correction of Earth Curvature
If the 3D-GK coordinate system X, Y, Z and the local Cartesian coordinate system Xg, Yg, Zg are both set with their origins at the scene centre, the difference in Xg and X or Yg and Y will be negligible, but for Z and Zg [i.e. the height coordinates] the difference will be appreciable as a result of Earth curvature. The height error at a ground point S km away from the origin is given by the well-known expression:
ΔZ = Y2/2R km
Where R = 6367 km. This effect amounts to 67 m in the margin of the SPOT scene used for the reported experiments.
The size of the test scene was 50×60 km, and at this scale you get altitude errors of up to 67 metres if you assume the Earth is flat, which is a large error!
Another paper compares the mathematical solution of stereo satellite altitude data to that of aerial photography (from a plane)[3]:
Some of the approximations used for handling usual aerial photos are not acceptable for space images. The mathematical model is based on an orthogonal coordinate system and perspective image geometry. […] In the case of direct use of the national net coordinates, the effect of the earth curvature is respected by a correction of the image coordinates and the effect of the map projection is neglected. This will lead to [unacceptable] remaining errors for space images. […] The influence of the earth curvature correction is negligible for aerial photos because of the smaller flying height Zf. For a [satellite] flying height of 300 km we do have a scale error of the ground height of 1:20 or 5%.
So the terrain mappers using stereo satellite data need to be aware of and correct for the curvature of the Earth to get their data to come out accurately.
Terrain mapping is done on relatively small patches of Earth. But we’ve already seen in our first proof photos of Earth taken from far enough away that you can see (one side of) the whole planet, such as the Blue Marble photo. Can we do one better, and look at two photos of the Earth taken from different positions at the same time? Yes, we can!
The U.S. National Oceanic and Atmospheric Administration operates the Geostationary Operational Environmental Satellite (GOES) system, manufactured and launched by NASA. Since 1975, NASA has launched 17 GOES satellites, the last four of which are currently operational as Earth observation platforms. The GOES satellites are in geostationary orbit 35790 km above the equator, positioned over the Americas. GOES-16 is also known as GOES-East, providing coverage of the eastern USA, while GOES-17 is known as GOES-West, providing coverage of the western USA. This means that these two satellites can take images of Earth at the same time from two slightly different positions (“slightly” here means a few thousand kilometres).
This means we can get stereo views of the whole Earth. We could in principle use this to calculate the shape of the Earth by triangulation using some mathematics, but there’s an even cooler thing we can do. If we view a GOES-16 image with our right eye, while viewing a GOES-17 image taken at the same time with our left eye, we can get a 3D view of the Earth from space. Let’s try it!
The following images show cross-eyed and parallel viewing pairs for GOES-16/GOES-17 images. Depending on your ability to deal with these images, you should be able to view a stereo 3D image of Earth. (Cross-eyed stereo viewing seems to be the most popular method on the Internet, but personally I’ve never been able to get it to work for me, whereas I find the parallel method fairly easy. I find it works best if I put my face very close to the screen to lock onto the initial image fusion, and then slowly pull my head backwards. Another option if you have a VR viewer for your phone, like Google Cardboard, is to load the parallel image onto your phone and view it with your VR viewer.)
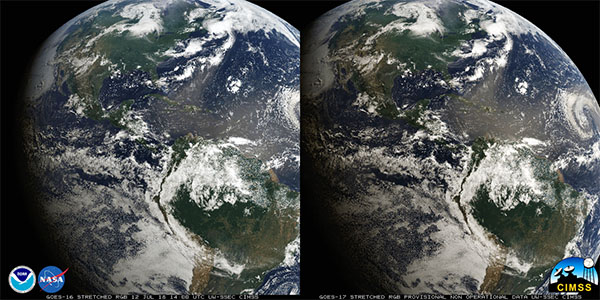
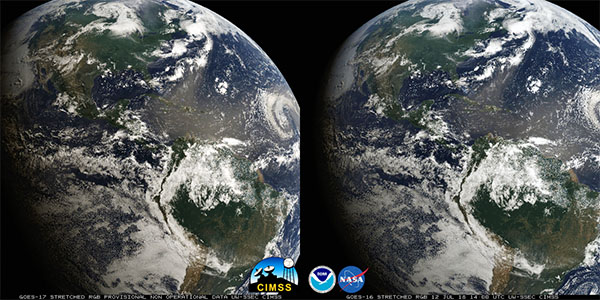
Unfortunately these images are cropped, but if you managed to get the 3D viewing to work, you will have seen that your brain automatically does the distance calculation ting as it would with a real object, and you can see for yourself with your own eyes that the Earth is rounded, not flat.
I’ve saved the best for last. The Japan Meteorological Agency operates the Himawari-8 weather satellite, and the Korea Meteorological Administration operates the GEO-KOMPSAT-2A satellite. Again these are both on geosynchronous orbits above the equator, this time placed so that Himawari-8 has the best view of Japan, while GEO-KOMPSAT-2A has the best view of Korea, situated slightly to the west. And here I found uncropped whole Earth images from these two satellites taken at the same time, presented again as cross-eyed and then parallel viewing pairs:
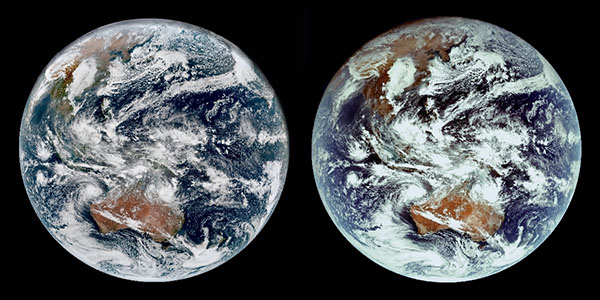
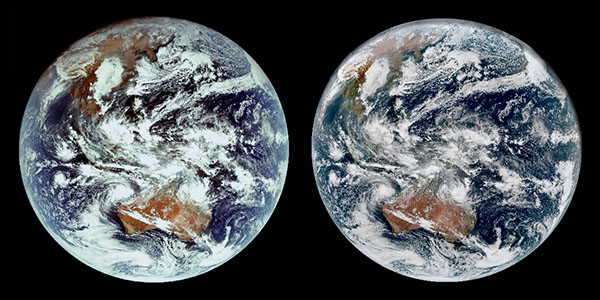
For those who have trouble with free stereo viewing, I’ve also turned these photos into a red-cyan anaglyphic 3D image, which is viewable with red-cyan 3D glasses (the most common sort of coloured 3D glasses)
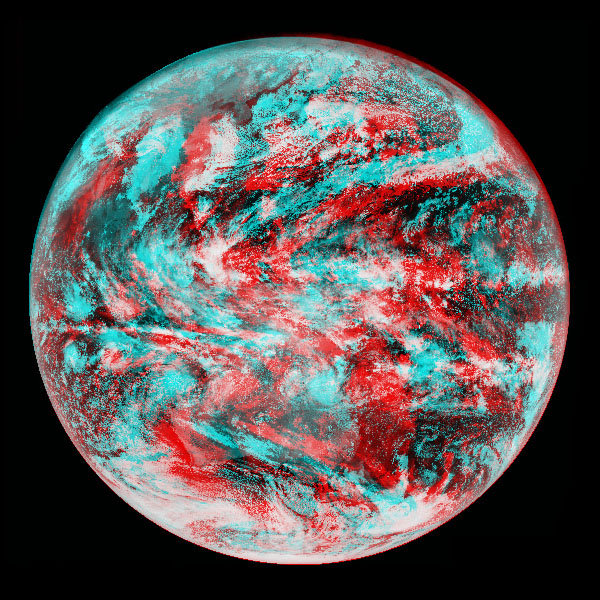
Hopefully you managed to get at least one of these 3D images to work for you (unfortunately some people find viewing stereo 3D images difficult). If you did, well, I don’t need to point out what you saw. The Earth is clearly, as seen with your own eyes, shaped like a sphere, not a flat disc.
References:
[1] Lang, M., Hornung, A., Wang, O., Poulakos, S., Smolic, A., Gross, M. “Nonlinear disparity mapping for stereoscopic 3D”. ACM Transactions on Graphics, 29 (4), p. 75-84. ACM, 2010. http://dx.doi.org/10.1145/1833349.1778812
[2] Hattori, S., Ono, T., Fraser, C., Hasegawa, H. “Orientation of high-resolution satellite images based on affine projection”. International Archives of Photogrammetry and Remote Sensing, 33(B3/1; PART 3) p. 359-366, 2000. https://www.isprs.org/proceedings/Xxxiii/congress/part3/359_XXXIII-part3.pdf
[3] Jacobsen, K. “Geometric aspects of high resolution satellite sensors for mapping”. ASPRS The Imaging & Geospatial Information Society Annual Convention 1997 Seattle. 1100(305), p. 230, 1997. https://www.ipi.uni-hannover.de/uploads/tx_tkpublikationen/jac_97_geom_hrss.pdf
[4] CIMSS Satellite blog, Space Science and Engineering Center, University of Wisconsin-Madison, “Stereoscopic views of Convection using GOES-16 and GOES-17”. 2018-07-12. https://cimss.ssec.wisc.edu/goes/blog/archives/28920 (accessed 2019-09-26).
[5] CIMSS Satellite blog, Space Science and Engineering Center, University of Wisconsin-Madison, “First GEOKOMPSAT-2A imagery (in stereo view with Himawari-8)”. 2019-02-04. https://cimss.ssec.wisc.edu/goes/blog/archives/31559 (accessed 2019-09-26).
