35. The Eötvös effect

In the opening years of the twentieth century, scientists in the field of geodesy (measuring the shape and gravitational field of the Earth) were interested in making measurements of the strength of gravity all over the Earth’s surface. To do this, they trekked to remote regions of the world with sensitive gravimeters, to take the readings. On land this was straightforward enough, but they also wanted measurements taken at sea.

Around 1900, teams from the Institute of Geodesy in Potsdam took voyages into the Atlantic, Indian, and Pacific Oceans on ships, and made measurements using their gravimeters. The collected data were brought back to Potsdam for analysis. There, the readings fell under the scrutinising eyes of the Hungarian physicist Loránd Eötvös, who specialised in studying the variation of Earth’s gravitational field with position on the surface. He noticed an odd thing about the readings.

Loránd Eötvös

Because of the impracticality of stopping the ship every time they wanted to take a reading, the scientists measured the Earth’s gravity while the ships were moving. There was no reason to suppose this would make any difference. But Eötvös found a systematic effect. Gravity measurements taken while the ship was moving eastward were lower than readings taken while the ship was moving westward.

Eötvös realised that this effect was being caused by the rotation of the Earth. The Earth’s equatorial circumference is 40,075 km, and it rotates eastward once every sidereal day (23 hours, 56 minutes). So the ground at the equator is rotating at a linear speed of 465 metres per second. To move in a circular path rather than a straight line (as dictated by Newton’s First Law of Motion), gravity supplies a centripetal force to any object on the Earth’s surface. The necessary force is equal to the object’s mass times the velocity squared, divided by the radius of the circular path (6378 km). This comes to m×4652/6378000 = 0.0339m. So per kilogram of mass, a force of 0.0339 newtons is needed to enforce the circular path, an amount easily supplied by the Earth’s gravity. (This is why objects don’t get flung off the Earth by its rotation, a complaint of some spherical Earth sceptics.)

What this means is that the effective acceleration due to gravity measured for an object sitting on the equator is reduced by 0.0339 m/s2 (the same units as 0.0339 N/kg) compared to if the Earth were not rotating. But if you’re on a ship travelling east at, say, 10 m/s, the centripetal force required to keep you on the Earth’s surface is greater, equal to 4752/6378000 = 0.0354 N/kg. This reduces the apparent measured gravity by a larger amount, making the measured value of gravity smaller. And if you’re on a ship travelling west at 10 m/s, the centripetal force is 4552/6378000 = 0.0324 N/kg, reducing the apparent gravity by a smaller amount and making the measured value of gravity greater. The difference in apparent gravity between the ships travelling east and west is 0.003 m/s2, which is about 0.03% of the acceleration due to gravity. For a person of mass 70 kg, this is a difference in apparent weight of about 20 grams (strictly speaking, a difference in weight of 0.2 newtons, which is 20 grams multiplied by acceleration due to gravity).

Eötvös set out these theoretical calculations, and then organised an expedition to measure and test his results. In 1908, the experiment was carried out on board a ship in the Black Sea, with two separate ships travelling east and west past one another so the measurements could be made at the same time. The results matched Eötvös’s predictions, thus confirming the effect.

In general (if you’re not at the equator), your linear speed caused by the rotation of the Earth is equal to 465 m/s times the cosine of your latitude, while the radius of your circular motion is also equal to 6378 km times the cosine of your latitude. The centripetal force formula uses the square of the velocity divided by the radius, so this results in a cosine(latitude) term in the final result. That is, the size of the Eötvös effect also varies as the cosine of the latitude. If you measure it at 60° latitude, either north or south, the difference in gravity between east and west travelling ships is half that measured at the equator.

The Eötvös effect is well known in the field of gravimetry, and is routinely corrected for when taking measurements of the Earth’s gravitational strength from moving ships[1], aircraft[2], or submarines[3]. The reference on submarines refers to a gravitational measurement module for use on military submarines to enhance their navigation capability as undersea instruments of warfare. This module includes an Eötvös effect correction for when the sub is moving east or west. You can bet your bottom dollar that no military force in the world would make such a correction to their navigation instruments if it weren’t necessary.

One paper I found reports measurements made of the detailed structure of gravitational anomalies over the Mariana Trough in the Pacific Ocean south of Japan. It states:

Shipboard free-air gravity anomalies were calculated by subtracting the normal gravity field data from observed gravity field data, with a correction applied for the Eötvös effect using Differential Global Positioning System (DGPS) data.[4]

The results look pretty cool:

Mariana Trough gravity anomalies map

Map of gravitational anomalies in the Mariana Trough region of the Pacific Ocean, as obtained by shipboard measurement, corrected for the Eötvös effect. (Figure reproduced from [4].)

Another paper shows the Eötvös effect more directly:

Gravity measurements from moving ship

Graph showing measurements of Earth’s gravitational field strength versus distance travelled by a ship in the South Indian Ocean. In the leftmost section (16), the ship is moving slowly westward. In the central section (17) the ship is moving at a faster speed westward, showing the increase in measured gravity. In the right section (18) the ship is moving eastward at slow speed, and the gravity readings are lower than the readings taken in similar positions while moving westward. (Figure reproduced from [5].)

If the Earth were flat, on the other hand, there would be no Eötvös effect at all. If the flat Earth is not rotating (as most models posit, with the sun moving above it in a circular path), obviously there is no centripetal acceleration happening at all. Even if you adopt a model where the flat Earth rotates about the North Pole, the centripetal acceleration at every point on the surface is parallel to the surface, towards the pole, not directed downwards. So an Eötvös-like effect would actually cause a slight deflection in the angle of gravity, but almost zero change in the magnitude of the gravity.

The Eötvös effect shows that not only is the Earth rotating, but that it is rotating about a central point that is underneath the ground, not somewhere on the surface. If you stand on the equator and face east, the surface of the Earth is rotating in the direction you are facing and downwards, not to the left or right. Furthermore, the cosine term shows that at equal latitudes both north and south, the rotation is at the same angle relative to the surface, which can only be the case if the Earth is symmetrical about the equator: i.e. spherical.

References:

[1] Rousset, D., Bonneville, A., Lenat, J.F. “Detailed gravity study of the offshore structure of Piton de la Fournaise volcano, Réunion Island”. Bulletin of Volcanology, 49(6), p. 713-722, 1987. https://doi.org/10.1007/BF01079822

[2] Thompson, L.G., LaCoste, L.J. “Aerial gravity measurements”. Journal of Geophysical Research, 65(1), p. 305-322, 1960. https://doi.org/10.1029/JZ065i001p00305

[3] Moryl, J., Rice, H., Shinners, S. “The universal gravity module for enhanced submarine navigation”. In IEEE 1998 Position Location and Navigation Symposium, p. 324-331, April 1996. https://doi.org/10.1109/PLANS.1998.670124

[4] Kitada, K., Seama, N., Yamazaki, T., Nogi, Y., Suyehiro, K., “Distinct regional differences in crustal thickness along the axis of the Mariana Trough, inferred from gravity anomalies”. Geochemistry, Geophysics, Geosystems, 7(4), 2006. https://doi.org/10.1029/2005GC001119

[5] Persson, A. “The Coriolis Effect: Four centuries of conflict between common sense and mathematics, Part I: A history to 1885”. History of Meteorology, 2, p.1-24, 2005. https://www.semanticscholar.org/paper/The-Coriolis-Effect%3A-Four-centuries-of-conflict-and-Persson/c9e72567af65e44384fba048bbf491d3ac3a30ff

33. Angle sum of a triangle

Differential geometry is the field of mathematics dealing with the geometry of surfaces, such as planes, curved surfaces, and also higher dimensional curved spaces. It’s used extensively in physics to deal with the space curvatures caused by gravity in the theory of general relativity, and also has applications in several other fields of science and engineering. In its simplest form, differential geometry deals with the shapes and mathematical properties of what we intuitively think of as “surfaces” – for example, a sheet of paper, a draped cloth, the surface of a ball, or the curved surface shape of something like a saddle.

One of the most important properties of a surface is the curvature, or more specifically the Gaussian curvature. Intuitively, this is just a measure of how curved the surface is, although in some cases the answer isn’t quite as intuitive as you might think. Imagine a flat surface, like a polished table top, or a completely flat, unbent sheet of paper. Straightforwardly enough, a flat surface like this has a Gaussian curvature value of zero.
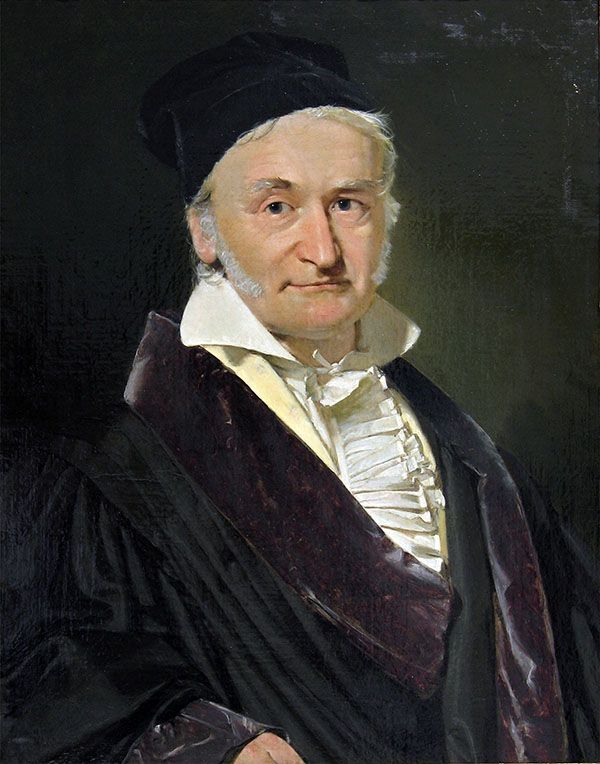
Carl Friedrich Gauss

Portrait of Carl Friedrich Gauss. (Public domain image from Wikimedia Commons.)

One of the most important results in differential geometry is the Theorema Egregium, which is Latin for “remarkable theorem”, proven by the 19th century German mathematician and physicist Carl Friedrich Gauss. The Theorema Egregium states that the Gaussian curvature of a surface does not change if the surface is bent without stretching it. So let’s take our flat sheet of paper and roll it up into a cylinder – we can do this without stretching or crumpling the paper. The resulting cylinder has the same curvature as the flat sheet, namely zero.

That might sound a bit strange, but it’s a result of the way that the Gaussian curvature of a surface is defined. A two-dimensional surface has two different directions that it can be curved in, and the two greatest amounts of curvature in different directions are called the principal curvatures. These measure how the surface bends by different amounts in different directions. Imagine drawing a straight line on a sheet of flat paper – the principal curvature in that direction is zero because the paper is flat. Now draw a line perpendicular to the first one – the principal curvature in that direction is also zero. The Gaussian curvature of the surface is the product of the two principal curvatures – in this case zero times zero.

Now if we roll the paper into a cylinder, we can draw a line around the circular part, creating a circle like a hoop around a barrel. This is the maximum curvature of the cylinder, so one of the principal curvatures, and is non-zero. It’s defined as a positive number equal to 1 divided by the radius r of the cylinder. As the radius gets smaller, this principal curvature 1/r gets bigger. But a cylinder has a second principal curvature, perpendicular to the first one. This is along a line running the length of the cylinder parallel to the axis, and this line is perfectly straight – not curved at all. So it has a principal curvature of zero. And the Gaussian curvature of the cylindrical surface is the product (1/r)×0 = 0.
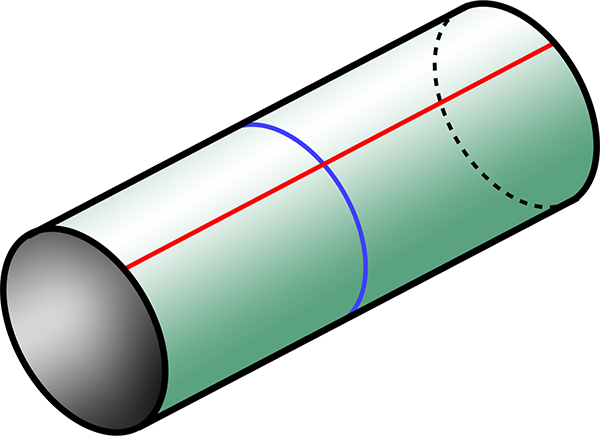
Cylinder

A cylinder, as could be formed by rolling a sheet of paper. The blue line is a line of maximum curvature, wrapped around the cylinder. The red line, along the cylinder perpendicular to the blue line, has zero curvature.

So what surfaces have non-zero Gaussian curvature? By the Theorema Egregium, they must be surfaces that you can’t bend a sheet of paper into without stretching it. An example is the surface of a sphere. If you try to wrap a sheet of paper smoothly around a sphere, you can’t do it without stretching, scrunching, or tearing the paper. If we draw a line around a sphere (like an equator), that’s one principal curvature, equal to 1/r, similar to the cylinder, where r is now the radius of the sphere. A line perpendicular to that (like a line of longitude), also has the same same principal curvature due to the symmetry of the sphere, 1/r. The Gaussian curvature of a sphere is then (1/r)×(1/r) = 1/r2.

And then there are surfaces with a saddle shape, bending upwards in one direction and downwards in a perpendicular direction. An example is the surface on the inside of the hole in a torus (or doughnut shape). If you imagine standing on the surface here, in one direction it curves downwards with a radius s equal to that of the solid part of the torus, while in the perpendicular direction the surface curves upwards with radius h, the radius of the hole. Curving upwards is defined as a negative curvature, so the two principal curvatures are 1/s and -1/h, and the Gaussian curvature here is the product, -1/sh.
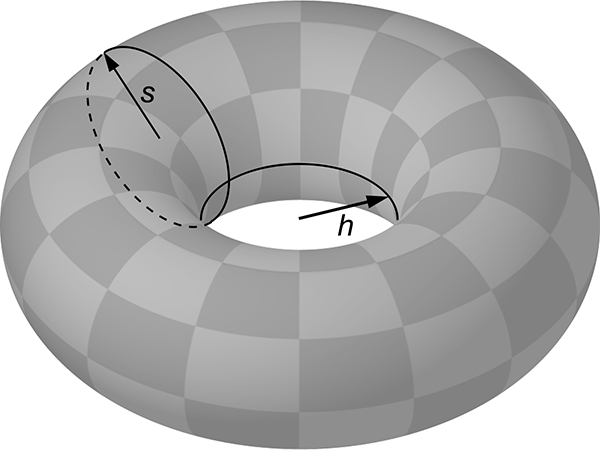
Torus showing radii

A torus, showing the solid radius s and the radius of the hole h. The point where the two circles intersect has Gaussian curvature -1/sh. (Image modified from public domain image from Wikimedia Commons.)

Here are examples of surfaces with negative, zero, and positive curvature, respectively a hyperboloid, cylinder, and sphere:
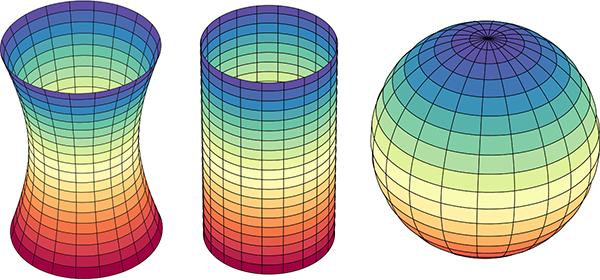
Surfaces with negative, zero, and positive curvatures

Illustration of surfaces with negative, zero, and positive Gaussian curvature: respectively a hyperboloid, cylinder, and sphere. (Image modified from public domain image from Wikimedia Commons.)

Another way to think about Gaussian curvature is to imagine wrapping a sheet of paper snugly onto the surface. If you can do it without stretching or tearing the paper (such as a cylinder), the curvature is zero. If you have to scrunch the paper up (like wrapping a sphere), the curvature is positive. If you have to stretch/tear the paper (like the saddle or hyperboloid), the curvature is negative. It’s also important to realise that the Gaussian curvature doesn’t need to be the same everywhere – it can vary across the surface. It’s zero at all points on a cylinder, and 1/r2 at all points on a sphere, but on a torus the curvature is negative on the inside of the hole and positive on the outside, with lines of zero curvature running around the top and bottom.

Torus showing positive and negative curvatures

Diagram of a torus, showing regions of positive (green) and negative (orange) Gaussian curvature. The boundary between the regions has zero curvature.

A property of two-dimensional curvature is that it affects the geometry of two-dimensional shapes on the surface. A surface with zero Gaussian curvature we call Euclidean, and the Euclidean geometry matches the familiar geometry we learn at primary and secondary school. This incudes all those properties of circles and triangles and parallel lines that you learnt. In particular, let’s talk about triangles. Triangles have three internal angles and, as we learnt in school, if you add up the sizes of the angles you get 180°. In the angular unit known as radians, 180° is equal to π radians. (To convert from degrees to radians, divide by 180 and multiply by π.)

So, in a Euclidean geometry, the angle sum of a triangle equals π radians. This is the case for triangles drawn on a flat sheet of paper, and it also holds if you wrap the paper around a cylinder. The triangle bends around the cylinder in the positive principal curvature direction, but its Gaussian curvature remains zero (because of the Theorema Egregium). And if you measure the angles and add them up, they still add up to π radians (i.e. 180°).

However if you draw a triangle on a surface of negative curvature, the lines are locally straight but from a three-dimensional point of view they are bowed inwards by the curvature of the surface, pinching the angles to make them smaller.
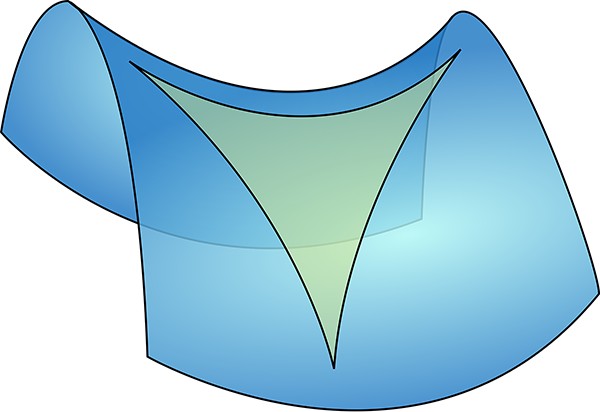
Saddle shaped surface with triangle

A saddle shaped surface with negative curvature, with a triangle drawn on it. The angles become pinched in and smaller. (Image modified from public domain image from Wikimedia Commons.)

On the other hand, if you draw a triangle on the surface of a sphere, which has positive curvature, the lines seem to bow outwards, making the angles larger.
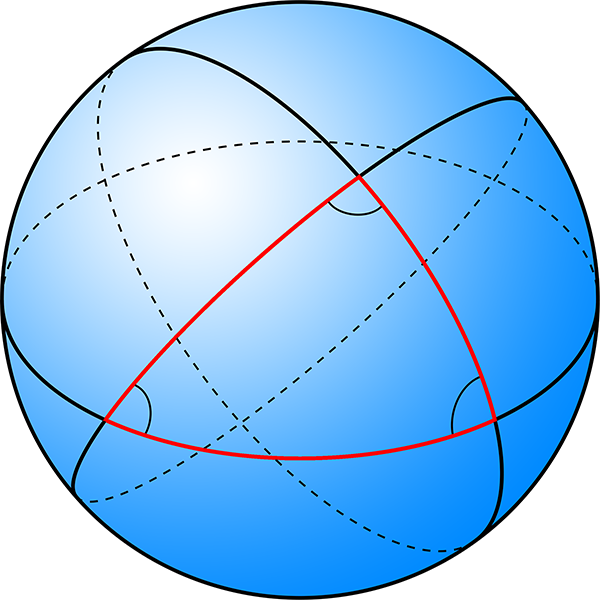
Spherical shaped surface with triangle

A spherical surface with positive curvature, with a triangle drawn on it. The angles become bulged out and larger. (Image modified from public domain image from Wikimedia Commons.)

Now, here’s the cool thing. On a negative curvature surface, the angle sum of a triangle is less than π radians, while on a positive curvature surface it’s greater than π radians. Imagine a really small triangle on either of these surfaces. Over a very small area, the curvature is not so evident, and the angle sum is only different from π radians by a small amount. But for a larger triangle, the curvature makes a bigger difference, and the angle sum differs from π radians by a larger amount. It turns out there’s a mathematical relationship between the Gaussian curvature of the surface, the size of the triangle, and the amount by which the angle sum differs from π radians:

The angle sum of a triangle = π radians + the integral of the Gaussian curvature over the area of the triangle. [Equation 1]

If you’re not familiar with calculus, the integral part basically means you take small patches of area within the triangle, multiply the Gaussian curvature in the patch by the area of the patch and add them all up. If the Gaussian curvature is constant (such as for a sphere), the integral is just equal to the curvature times the area of the triangle.

To take a concrete example, imagine a sphere of radius one unit. The surface area of the sphere is 4π square units. Now let’s draw a triangle on the sphere. If we imagine the sphere with lines of latitude and longitude like the Earth, we’ll take the equator as one of our triangle sides, and two lines of longitude running from the North Pole to the equator, 90° apart. The angle between the equator and any line of longitude is 90° (π/2 radians), and the angle at the North Pole between our chosen two lines of longitude is also 90° (by construction). So the angle sum of this triangle is 3π/2 radians, which is π/2 radians greater than π radians.

From equation 1, this means that the integral of the Gaussian curvature over the triangle equals π/2. The area of the triangle is one eighth the surface area of the whole sphere = 4π/8 = π/2 square units. The Gaussian curvature of a sphere is constant, so curvature×(π/2 square units) = π/2, which means the curvature is equal to 1. We said the sphere has a radius of one unit, and Gaussian curvature of a sphere is 1/r2, so the curvature is just 1. It all works out!

Now imagine we’re looking at such a triangle on the Earth itself. Our edges are the equator, and we’ll take the lines of longitude 30° west (running through eastern Greenland) and 60° east (through Russia and Kazakhstan, among other places). The area of this triangle, if we measured it, turns out to be 63.8 million square kilometres.
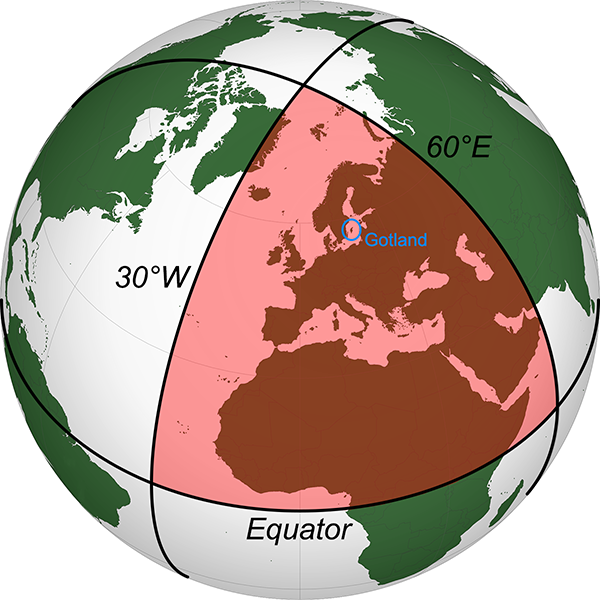
A large triangle on Earth

A triangle on Earth, with each angle equal to 90°. (Image modified from public domain image from Wikimedia Commons.)

Applying equation 1:

Angle sum of triangle = π radians + integral of Gaussian curvature over the area of the triangle

3π/2 radians = π radians + Gaussian curvature × 63.8 million square kilometres

π/2 radians = Gaussian curvature × 63.8 million square kilometres

Gaussian curvature = (π/2)/63.8×106

1/r2 = (π/2)/63.8×106

r2 = 63.8×10⁶/(π/2)

r = √[63.8×10⁶/(π/2)]

r = 6371 kilometres

This is the radius of the Earth. And it’s exactly right. So simply by measuring the angles of a triangle drawn on the surface of the Earth, and the area within that triangle, we can show that the surface of the Earth is not flat, but curved, and we can determine the radius of the Earth.

Obviously I haven’t gone out and measured such a triangle in practice. It would take expensive surveying gear and an extensive travel budget, but in principle you can certainly do it. Because the effect of the curvature depends on the size of the triangle, you need to survey a large enough area to detect the Earth’s curvature. How large?

I did some searching for angular accuracy of large scale surveys, but didn’t find anything particularly convincing. As a first estimate, I guessed conservatively that you might be able to measure the angles of a very large triangle to an accuracy of a tenth of a degree. With three corners, this makes the necessary deviation of the angle sum from π equal to 0.005 radians. The necessary area to see the effect of curvature is this number times the square of Earth’s radius, which gives 203,000 square kilometres, about the area of Belarus, or Kyrgyzstan. If you surveyed a triangle that big, measuring the area accurately and the angles to within 0.1° accuracy, you could experimentally verify that the Earth was curved, not flat.

A reference on the accuracy of Global Navigation Satellite Systems used for geodetic surveying [1], gives an angular accuracy better than my guess, in the order of 2 minutes of arc (i.e. 1/30°) for this method. This gives us a necessary area of 20,300 square kilometres, about the area of Slovenia or Israel. Another reference on laser scanners used in surveying [2] gives an angular resolution of 3 mm over a range of 100 m, equivalent to 6 seconds of arc. If we can survey the angles of a triangle this accurately, we only need to measure an area of 1220 square kilometres, which is smaller than the Indian Ocean island nation of Comoros, and about the size of Gotland, Sweden’s largest island (circled in blue in the above figure).

Interestingly, Gauss was likely inspired to develop a mathematical treatment of curvature by his experience as a surveyor. In the 1820s, he was tasked with surveying the Kingdom of Hanover (now part of Germany). To check the calibration of his equipment, he surveyed a large triangle with corners on the tops of the mountains Brocken, Hoher Hagen, and Großer Inselsberg, encompassing an area of 3000 km2. Each mountaintop had direct line of sight to the others, so this was not actually a survey of a curved triangle along the surface of the Earth, but rather a flat triangle through 3D space above the surface of the Earth. Gauss considered this a validation check on the accuracy of the equipment, rather than a test to see if the Earth was curved. He measured the angles and added them up, finding the sum to be 180° to within his measurement uncertainty. Although this was not the curvature experiment described above, Gauss later drew on his surveying experience to investigate the properties of curved surfaces.

This concludes the “Earth is a Globe” portion of this entry, but there are two other cool applications of differential geometry:

Firstly, curvature of this type applies not only to two-dimensional surfaces, but also to three-dimensional space. It’s possible that the 3D space we live in has a non-zero curvature. This sort of curvature is tied up in general relativity, gravity, and the expansion of the universe. We know the curvature of space is very close to zero, but not if it’s exactly zero – it may be slightly positive or negative. To measure the curvature of space directly, all we need to do is measure the angles of a large enough triangle. In this case, large enough means millions of light years. We can’t send surveyors out that far, but imagine if we contacted two alien civilisations by radio. It would take millions of years to coordinate, but we could ask them to measure the angles between our sun and the sun of the other civilisation at some predetermined time, and we could combine it with our own measurement, to determine the angle sum of this enormous triangle. If it doesn’t equal π radians, we’d have a direct measurement of the curvature of the universe.

Secondly, and perhaps more practically, the Theorema Egregium helps us eat pizza. If you take a long slice of pizza (and the base is not thick/crispy enough to be rigid), the tip can flop down messily.

A floppy slice of pizza

A slice of pizza flopping along its length. Danger of making a mess!

Differential geometry to the rescue! The slice begins flat, so has zero Gaussian curvature. It can bend in one direction, flopping down and making a mess. But if we fold the slice by pushing the ends of the crust upwards and together, this creates a non-zero principal curvature across the slice. By the Theorema Egregium, the Gaussian curvature (the product of the principal curvatures) must remain zero, so the principal curvature in the perpendicular direction along the slice is now fixed at zero, and the slice cannot flop down any more!

A rigid slice of pizza

A slice of pizza curved perpendicular to the length can no longer flop. Danger averted, thanks to differential geometry!

References:

[1] Correa-Muños, N. A., Cerón-Calderón, L. A. 2018. “Precision and accuracy of the static GNSS method for surveying networks used in Civil Engineering”. Ingeniería e Investigación, 38(1), p. 52-59, 2018. https://doi.org/10.15446/ing.investig.v38n1.64543

[2] Fröhlich, C. Mettenleiter, M. “Terrestrial laser scanning—new perspectives in 3D surveying”. International archives of photogrammetry, remote sensing and spatial information sciences, 36(8), p.W2, 2004. https://www.semanticscholar.org/paper/TERRESTRIAL-LASER-SCANNING-–-NEW-PERSPECTIVES-IN-3-Froehlich-Mettenleiter/4e117d837e43da8b9e281aec1ce9a8625430b6c3

32. Satellite laser ranging

Lasers are amazing things. However, when first invented, they were famously derided as “a solution looking for a problem”. The American physicist Theodore Maiman built the first laser in 1960, which is possibly earlier than you realised. This is because for several years nobody knew what to use them for, and there was no visible technology that made use of lasers. Their main use was as a device for science fiction, where authors imagined them being used as weapons.

This changed in the 1970s, when laser barcode scanners were invented. These essentially just use a laser as a narrow-beam source of light, which is scanned across the barcode using a rotating mirror. A light sensor detects the pattern of light and dark reflections from the barcode and circuitry turns that into digital data, which can then be processed by an attached computer, revealing information such as a product catalogue number. This is hardly a ground-breaking application; you can (and in fact manufacturers do) make barcode scanners using normal light sources as well.

The first consumer device to use lasers was the LaserDisc player in 1978, a home video format using technology that was the forerunner of the compact disc audio player released in 1982. These devices use precisely focused lasers to read tiny indentations on a reflective surface, turning them into data (analogue in the case of LaserDiscs, digital for CDs), in a way broadly similar to a barcode reader. However here the indentations are so small that doing the same with a normal light source would be prohibitively difficult. And so lasers finally found a widespread use.

Today lasers are used in so many applications and technologies that it would be difficult to imagine life without them. They are vital to modern optical fibre communications networks; have many uses in industry for cutting, welding, scanning, and manufacturing, including 3D printing; are used in many forms of surgery and cancer treatments; and have dozens of consumer uses from laser pointers to printers to entertainment.

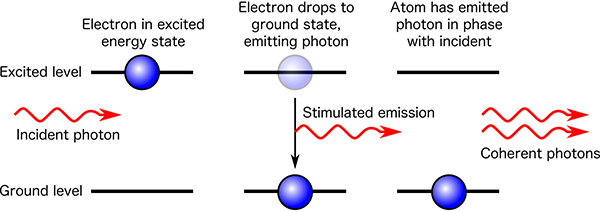
A laser is a device that emits light through a process known as stimulated emission. This occurs when a population of atoms exists in an excited energy state, meaning that the energy of one or more electrons in some of the atoms is not at the usual minimum energy state. In such a case, an electron can drop back down to the minimum energy state, emitting the excess energy as a photon of light; this is known as spontaneous emission. The stimulated emission part occurs when a photon interacts with another excited atom, triggering it to also drop into the minimum energy state and release a photon of the same energy. This stimulated photon is emitted in the same direction and with the same phase as the original photon (meaning the peaks and troughs of the light waves are in synch). As more emission is stimulated, an intense beam of light of a single wavelength, all travelling in the same direction is generated, known as a coherent beam.

Stimulated emission

Diagram of stimulated emission. The electron energy levels are within the confines of an atom (not shown).

Mechanically, this can be produced by using a transparent medium such as a gas or crystal, in a long cylinder shape surrounded by a bright strobe tube to supply the energy to excite the atoms. One end of the cylinder is a mirror, and the other end is a partly reflective mirror which lets some of the beam out. The light that emerges is a laser beam. Because the light is coherent, it doesn’t spread out like normal light, but travels in a tight line, illuminating only a small spot when it hits something. This means a laser beam is capable of travelling far greater distances than a normal light source of the same intensity, while still being bright enough to be observed.

Diagram of a laser

One of the very first applications for lasers was invented in 1961, but was restricted to industry and research for a decade. If you aim a brief laser pulse at something and time how long it takes for the reflection to come back, you can divide by the speed of light to calculate the distance to the object. This is called lidar, a portmanteau of “light” and “radar”, as it’s the same principle applied to light instead of radio waves. Lidar works to a range of several kilometres for detecting normal objects that partially reflect the incident beam.

But we can do a lot better if we construct a special target that reflects back virtually all of the incident beam. This can be done with a retroreflector. A common design is three flat mirrors arranged around a 90° corner, like the corner of a box. The combination of reflection off all three surfaces means that any incoming beam of light will be reflected back exactly towards its source, no matter what angle it comes in at. If you shine a laser at one of these, you can detect the return pulse over a much greater range. This form of lidar is known as laser ranging.

Retroreflector diagram

A corner retroreflector. No matter which direction incident light arrives from, the reflected beam returns in the same direction. (Public domain image from Wikimedia Commons.)

In 1964, NASA launched the Explorer 22 satellite into near-Earth orbit, about 1000 kilometres altitude. Its main mission was to perform science on the Earth’s ionosphere, but it was also equipped with a retroreflector, and was the first object in space to have its distance measured using satellite laser ranging.

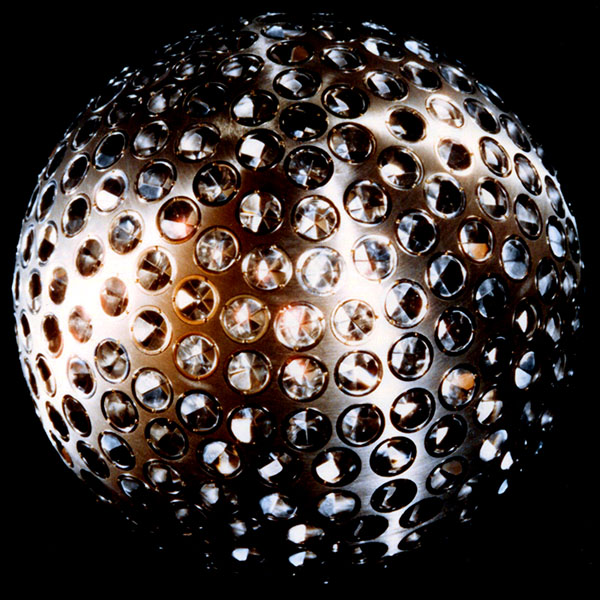
In 1976, NASA launched LAGEOS 1, a satellite designed specifically for laser ranging. LAGEOS has no active components, it is simply a brass sphere, coated in aluminium, with 426 retroreflectors embedded in the surface, so that no matter which way the satellite tumbles, dozens of reflectors are always oriented towards Earth.

LAGEOS 1 model

Model of LAGEOS 1 satellite. (Public domain image by NASA, from nasa.gov.)

LAGEOS 1 is in medium-Earth orbit, at an altitude of nearly 6000 km. This orbit is far from any perturbing influences and so is extremely stable, meaning the satellite’s position at any time can be calculated to a small fraction of a millimetre. This makes it a useful reference point for measuring the distances to stations on the Earth’s surface, by aiming lasers at the satellite and timing the reflected signal.

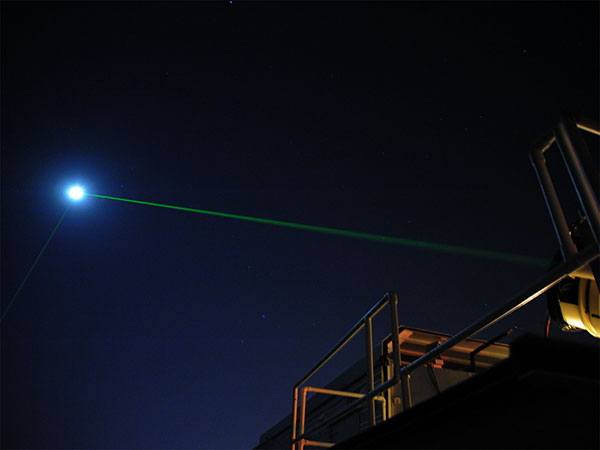
Laser ranging from an observatory

Satellite laser ranging in action. Laser Ranging Facility at the Geophysical and Astronomical Observatory at NASA’s Goddard Spaceflight Center. The lasers are aimed at the Lunar Reconnaissance Orbiter, in orbit around the moon. (Public domain image by NASA from Wikimedia Commons.)

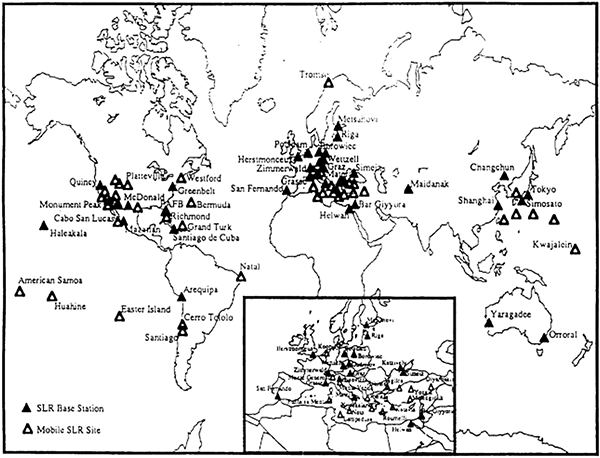
These measurements are so precise that they give the distance from the ground station to the satellite to an uncertainty of less than one millimetre. By using a reference point located away from Earth, this provides a method of checking motions of the Earth caused by weather systems, earthquakes, isostatic rebound (the slow rising of land in the millennia after glacial ice sheets melted), and tectonic drift. For example, geophysical tectonic modelling suggests that the Hawaiian Islands should be drifting northwards at approximately 70 mm per year. Measurement of the position of the Haleakala laser base station in Hawaii using LAGEOS and similar satellites shows this to be the case.

Laser ranging stations worldwide

Satellite laser ranging stations around the world. (Figure reproduced from [1].)

Laser ranging can also be (and is) used to measure the shape of the Earth. More specifically, it’s used to measure the shape of the geoid, which is the shape that corresponds to mean sea level (averaging out tides and weather) all over the Earth. More formally this is defined as the surface where the Earth’s gravitational field strength is identical to that at sea level. In areas of land, this surface is generally under the ground. The geoid is not perfectly spherical due to the uneven distribution of mass in the Earth. We’ve mentioned a few times that the Earth is approximately an ellipsoid due to the rotational force flattening the poles and causing a bulge at the equator. The geoid is almost an ellipsoid, but varies locally by up to approximately ±100 metres.

Diagram of the geoid

The geoid surface relative to an ellipsoid, shown as highly exaggerated relief. The darkest blue area below India is -106 m, while the red area near Iceland is +85 m. (Creative Commons Attribution 4.0 International image by the International Centre for Global Earth Models, from Wikimedia Commons.)

Besides LAGEOS 1 and 2, there are a handful of other similar retroreflector satellites. And there are also retroreflectors on the moon. Astronauts on NASA’s Apollo 11, 14, and 15 missions set up retroreflector arrays on the moon’s surface, and the unmanned Russian probes Lunakhod 1 and 2 also have retroreflectors.

Retroreflector on the moon

Retroreflector array set up on the lunar surface by Neil Armstrong and Buzz Aldrin during the Apollo 11 mission. (Public domain image by NASA from Wikimedia Commons.)

Since 1969, several lunar laser ranging experiments have been ongoing, making regular measurements of the distance between the Earth stations and the reflectors on the moon. These measurements can also determine the distance to better than one millimetre.

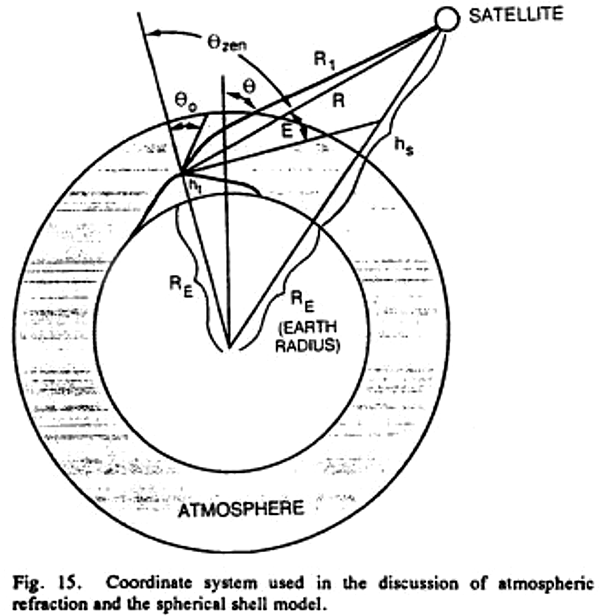
If you measure the distances from either an artificial satellite or the moon to different points on the Earth’s surface, it’s trivial to show that the points don’t lie even approximately on a flat plane, but that they lie on the surface of an approximately spherical body with the radius of the Earth. Finding an explicit statement such as “This demonstrates that the Earth is not flat, but spherical” in a published scientific article is difficult (because that result is neither surprising nor groundbreaking), but the following diagram shows the model that laser ranging scientists use to correct for effects such as atmospheric refraction, to enable them to get their measurements accurate down to a millimetre.

Model of Earth used for accurate laser ranging

Atmospheric refraction model used by laser ranging scientists. (Figure reproduced from [1].)

This shows clearly that laser ranging scientists—who have explicit and direct measurements of the shape of the Earth’s surface—assume the Earth is spherical in order to refine their calculations. They’d hardly do that if the Earth were flat.

References:

[1] Degnan, J. J. “Millimeter accuracy satellite laser ranging: a review”. Contributions of Space Geodesy to Geodynamics: Technology, 25, p.133-162, 1993. https://doi.org/10.1029/GD025p0133

[2] Murphy Jr., T. W. “Lunar Laser Ranging: The Millimeter Challenge”. Reports on Progress in Physics, 76(7), p. 076901, 2013. https://doi.org/10.1088/0034-4885/76/7/076901

19. Bridge towers

When architects design and construction engineers build towers, they make them vertical. By “vertical” we mean straight up and down or, more formally, in line with the direction of gravity. A tall, thin structure is most stable if built vertically, as then the centre of mass is directly above the centre of the base area.

If the Earth were flat, then vertical towers would all be parallel, no matter where they were built. On the other hand, if the Earth is curved like a sphere, then “vertical” really means pointing towards the centre of the Earth, in a radial direction. In this case, towers built in different places, although all locally vertical, would not be parallel.

The Humber Bridge spans the Humber estuary near Kingston upon Hull in northern England. The Humber estuary is very broad, and the bridge spans a total of 2.22 kilometres from one bank to the other. It’s a single-span suspension bridge, a type of bridge consisting of two tall towers, with cables strung in hanging arcs between the towers, and also from the top of each tower to anchor points on shore. (It’s the same structural design as the more famous Golden Gate Bridge in San Francisco.) The cables extend in both directions from the top of each tower to balance the tension on either side, so that they don’t pull the towers over. The road deck of the bridge is suspended below the main cables by thinner cables that hang vertically from the main cables. The weight of the road deck is thus supported by the main cables, which distribute the load back to the towers. The towers support the entire weight of the bridge, so must be strong and, most importantly, exactly vertical.

The Humber Bridge

The Humber Bridge from the southern bank of the Humber. (Public domain image from Wikimedia Commons.)

The towers of the Humber Bridge rest on pylons in the estuary bed. The towers are 1410 metres apart, and 155.5 metres high. If the Earth were flat, the towers would be parallel. But they’re not. The cross-sectional centre lines at the tops of the two towers are 36 millimetres further apart than at the bases. Using similar triangles, we can calculate the radius of the Earth from these dimensions:

Radius = 155.5×1410÷0.036 = 6,090,000 metres

This gives the radius of the Earth as 6100 kilometres, close to the true value of 6370 km.

Size of the Earth from the Humber Bridge

Diagram illustrating use of similar triangles to determine the radius of the Earth from the Humber Bridge data. (Not to scale!)

If this were the whole story, it would pretty much be case closed at this point. However, despite a lot of searching, I couldn’t find any reference to the distances between the towers of the Humber Bridge actually being measured at the top and the bottom. It seems that the figure of 36 mm was probably calculated, assuming the curvature of the Earth, which makes this a circular argument (pun intended).

Interestingly, I did find a paper about measuring the deflection of the north tower of the Humber Bridge caused by wind loading and other dynamic stresses in the structure. The paper is primarily concerned with measuring the motion of the road deck, but they also mounted a kinematic GPS sensor at the top of the northern tower[1].

GPS sensor on Humber Bridge north tower

Kinematic GPS sensor mounted on the top of the north tower of the Humber Bridge. (Reproduced from [1].)

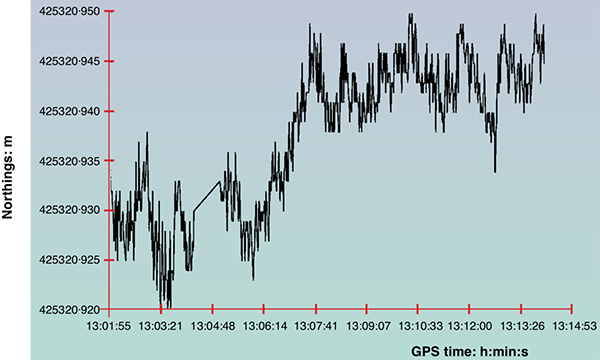
The authors carried out a series of measurements, and show the results for a 15 minute period on 7 March, 1996.

Deflections of Humber Bridge north tower

North-south deflection of the north tower of the Humber Bridge over a 15 minute period. The vertical axis is metres relative to a standard grid reference, so the full vertical range of the graph is 30 mm. (Reproduced from [1].)

From the graph, we can see that the tower wobbles a bit, with deflections of up to about ±10 mm from the mean position. The authors report that the kinematic GPS sensors are capable of measuring deflections as small as a millimetre or two. So from this result we can say that the typical amount of flexing in the Humber Bridge towers is smaller than the supposed 36 mm difference that we should be trying to measure. So, in principle, we could measure the fact that the towers are not parallel, even despite motion of the structure in environmental conditions.

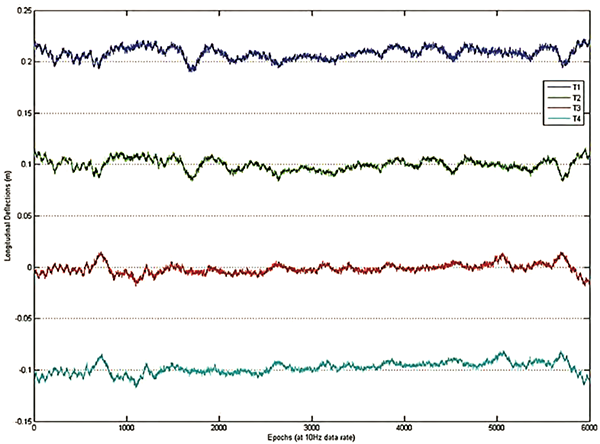
A similar result is seen with the Severn Bridge, a suspension bridge over the Severn River between England and Wales. It has a central span of 988 metres, with towers 136 metres tall. A paper reports measurements made of the flexion of both towers, showing typical deflections at the top are less than 10 mm[2].

Deflections of Severn Bridge towers

Plot of deflection of the top of the suspension towers along the axis of the Severn Bridge. T1 and T2 (upper two lines) are measurements made by two independent sensors at the top of the west tower; T3 and T4 (lower lines) are measurements made by sensors on the east tower. Deflection is in units of metres, so the scale of the maximum deflections is about 10 mm. (Reproduced from [2].)

Okay, so we could in principle measure the mean positions of the tops of suspension bridge towers with enough precision to establish that the towers are further apart at the top than the base. A laser ranging system could do this with ease. Unfortunately, in all my searching I couldn’t find any citations for anyone actually doing this. (If anyone lives near the Humber Bridge and has laser ranging equipment, climbing gear, a certain disregard for authority, and a deathwish, please let me know.)

Something I did find concerned the Verrazzano-Narrows Bridge in New York City. It has a slightly smaller central span than the Humber Bridge, with 1298 metres between its two towers, but the towers are taller, at 211 metres. The tops of the towers are reported as being 41.3 mm further apart than the bases, due to the curvature of the Earth. There are also several citations backing up the statement that “the curvature of the Earth’s surface had to be taken into account when designing the bridge” (my emphasis).[3]

Verrazzano-Narrows Bridge

Verrazzano-Narrows Bridge, linking Staten Island (background) and Brooklyn (foreground) in New York City. (Public domain image from Wikimedia Commons.)

So, this prompts the question: Do structural engineers really take into account the curvature of the Earth when designing and building large structures? The answer is—of course—yes, otherwise the large structures they build would be flawed.

There is a basic correction listed in The Engineering Handbook (published by CRC) to account for the curvature of the Earth. Section 162.5 says:

The curved shape of the Earth… makes actual level rod readings too large by the following approximate relationship: C = 0.0239 D2 where C is the error in the rod reading in feet and D is the sighting distance in thousands of feet.[4]

To convert to metric we need to multiply the constant by the number of feet in a metre (because of the squared factor), giving the correction in metres = 0.0784×(distance in km)2. What this means is that over a distance of 1 kilometre, the Earth’s surface curves downwards from a perfectly straight line by 78.4 millimetres. This correction is well known among civil and structural engineers, and is applied in surveying, railway line construction, bridge construction, and other areas. It means that for engineering purposes you can’t treat the Earth as both flat and level over distances of around a kilometre or more, because it isn’t. If you treat it as flat, then a kilometre away your level will be off by 78.4 mm. If you make a surface level (as measured by a level or inclinometer at each point) over a kilometre, then the surface won’t be flat; it will be curved parallel to the curvature of the Earth, and 78.4 mm lower than flat at the far end.

An example of this can be found at the Volkswagen Group test track facility near Ehra-Lessien, Germany. This track has a circuit of 96 km of private road, including a precision level-graded straight 9 km long. Over the 9 km length, the curvature of the Earth drops away from flat by 0.0784×92 = 6.35 metres. This means that if you stand at one end of the straight and someone else stands at the other end, you won’t be able to see each other because of the bulge of the Earth’s curvature in between. The effect can be seen in this video[5].

One set of structures where this difference was absolutely crucial is the Laser Interferometer Gravitational-Wave Observatory (LIGO) constructed at two sites in Hanford, Washington, and Livingston, Louisiana, in the USA.

LIGO site at Hanford

The LIGO site at Hanford, Washington. Each of the two arms of the structure are 4 km long. (Public domain image from Wikimedia Commons.)

LIGO uses lasers to detect tiny changes in length caused by gravitational waves from cosmic sources passing through the Earth. The lasers travel in sealed tubes 4 km long, which are under high vacuum. Because light travels in a straight line in a vacuum, the tubes must be absolutely straight for the machine to work. The tubes are level in the middle, but over the 2 km on either side, the curvature of the Earth falls away from a straight line by 0.0784×22 = 0.314 metres. So either end of the straight tube is 314 mm higher than the centre of the tube. To build LIGO, they laid a concrete foundation, but they couldn’t make it level over the distance; they had to make it straight. This required special construction techniques, because under normal circumstances (such as Volkswagen’s track at Ehra-Lessien) you want to build things level, not straight.[6]

So, the towers of large suspensions bridges almost certainly are not parallel, due to the curvature of the Earth, although it seems nobody has ever bothered to measure this. But it’s certainly true that structural engineers do take into account the curvature of the Earth for large building projects. They have to, because if they didn’t there would be significant errors and their constructions wouldn’t work as planned. If the Earth were flat they wouldn’t need to do this and wouldn’t bother.

UPDATE 2019-07-10: NASA’s Jet Propulsion Laboratory has announced a new technique which they can use to detect millimetre-sized shifts in the position of structures such as bridges, using aperture synthesis radar measurements from satellites. So maybe soon we can have more and better measurements of the positions of bridge towers![7]

References:

[1] Ashkenazi, V., Roberts, G. W. “Experimental monitoring of the Humber bridge using GPS”. Proceedings of the Institution of Civil Engineers – Civil Engineering, 120, p. 177-182, 1997. https://doi.org/10.1680/icien.1997.29810

[2] Roberts, G. W., Brown, C. J., Tang, X., Meng, X., Ogundipe, O. “A Tale of Five Bridges; the use of GNSS for Monitoring the Deflections of Bridges”. Journal of Applied Geodesy, 8, p. 241-264, 2014. https://doi.org/10.1515/jag-2014-0013

[3] Wikipedia: “Verrazzano-Narrows Bridge”, https://en.wikipedia.org/wiki/Verrazzano-Narrows_Bridge, accessed 2019-06-30. In turn, this page cites the following sources for the statement that the curvature of the Earth had to be taken into account during construction:

[3a] Rastorfer, D. Six Bridges: The Legacy of Othmar H. Ammann. Yale University Press, 2000, p. 138. ISBN 978-0-300-08047-6.

[3b] Caro, R.A. The Power Broker: Robert Moses and the Fall of New York. Knopf, 1974, p. 752. ISBN 978-0-394-48076-3.

[3c] Adler, H. “The History of the Verrazano-Narrows Bridge, 50 Years After Its Construction”. Smithsonian Magazine, Smithsonian Institution, November 2014.

[3d] “Verrazano-Narrows Bridge”. MTA Bridges & Tunnels. https://new.mta.info/bridges-and-tunnels/about/verrazzano-narrows-bridge, accessed 2019-06-30.

[4] Dorf, R. C. (editor). The Engineering Handbook, Second Edition, CRC Press, 2018, ISBN 978-0-849-31586-2.

[5] “Bugatti Veyron Top Speed Test”. Top Gear, BBC, 2008. https://youtu.be/LO0PgyPWE3o?t=200, accessed 2019-06-30.

[6] “Facts about LIGO”, LIGO Caltech web site. https://www.ligo.caltech.edu/page/facts, accessed 2019-06-30.

[7] “New Method Can Spot Failing Infrastructure from Space”, NASA JPL web site. https://www.jpl.nasa.gov/news/news.php?feature=7447, accessed 2019-07-10.

18. Polar motion

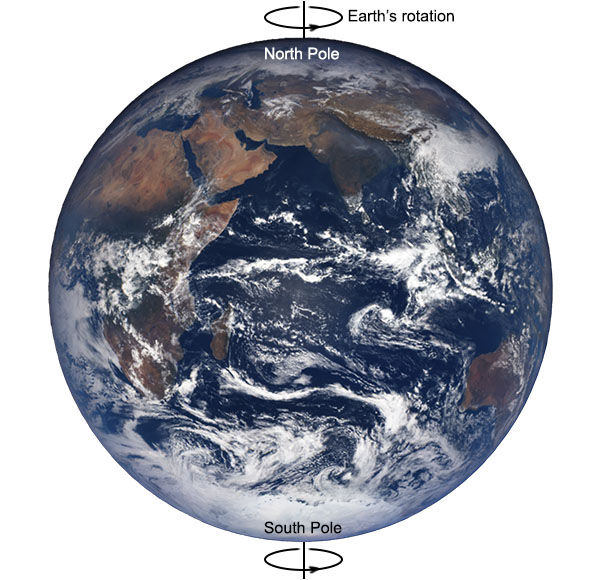
The Earth rotates around an axis, an imaginary straight line that all points not on the line move around in circles. The axis passes through the Earth’s North Pole and the South Pole. So the positions of the two Poles are defined by the position of the rotation axis.

Earth rotation and poles

The Earth’s North and South Poles are defined as the points where the axis of rotation passes through the surface of the planet. (Earth photo is a public domain image from NASA.)

Interestingly, the Earth’s rotation axis is not fixed – it moves slightly. This means that the Earth’s poles move.

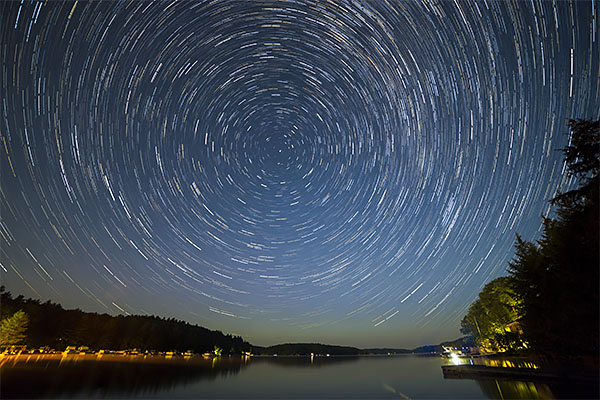
The positions of the Earth’s poles can be determined by looking at the motions of the stars. As we’ve already seen, if you observe the positions of stars throughout a night, you will see that they rotate in the sky about a central point. The point on the Earth’s surface directly underneath the centre of rotation of the stars is one of the poles of the Earth.

Star trails in the northern hemisphere

Star trails above Little Hawk Lake in Canada. The northern hemisphere stars rotate around the North Celestial Pole (the point directly above the Earth’s North Pole). The bright spot in the centre is Polaris, the pole star. The circles are somewhat distorted in the upper corners of the photo because of the wide angle lens used. (Creative Commons Attribution 2.0 image by Dave Doe.)

Through the 19th century, astronomers were improving the precision of astronomical observations to the point where the movement of the Earth’s rotational poles needed to be accounted for in the positions of celestial objects. The motion of the poles was also beginning to affect navigation, because as the poles move, so does the grid system of latitude and longitude that ships rely on to reach their destinations and avoid navigational hazards. In 1899 the International Geodetic Association established a branch known as the International Latitude Service.

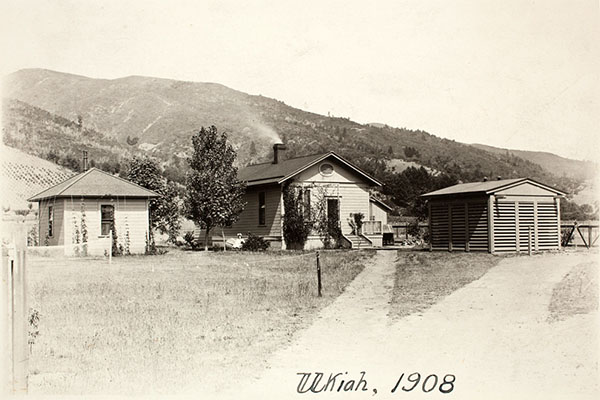
The fledgling International Latitude Service established a network of six observatories, all located close to latitude 39° 08’ north, spread around the world. The initial observatories were located in Gaithersburg, Maryland, USA; Cincinatti, Ohio, USA; Ukiah, California, USA; Mizusawa, Japan; Charjui, Turkestan; and Carloforte, Italy. The station in Charjui closed due to economic problems caused by war, but a new station opened in Kitab, Uzbekistan after World War I. Each observatory engaged in a program of observing the positions of 144 selected reference stars, and the data from each station were cross referenced to provide accurate measurements of the location of the North Pole.

International Latitude Service station in Ukiah

International Latitude Service station in Ukiah, California. (Public domain image from Wikimedia Commons.)

In 1962, the International Time Bureau founded the International Polar Motion Service, which incorporated the International Latitude Service observations and additional astronomical observations to provide a reference of higher accuracy, suitable for both navigation and defining time relative to Earth’s rotation. Finally in 1987, the the International Astronomical Union and the International Union of Geodesy and Geophysics established the International Earth Rotation Service (IERS), which took over from the International Polar Motion Service. The IERS is the current authority responsible for timekeeping and Earth-based coordinate systems, including the definitions of time units, the introduction of leap seconds to keep clocks in synch with the Earth’s rotation, and definitions of latitude and longitude, as well as measurements of the motion of the Earth’s poles, which are necessary for accurate use of navigation systems such as GPS and Galileo.

The motion of Earth’s poles can be broken down into three components:

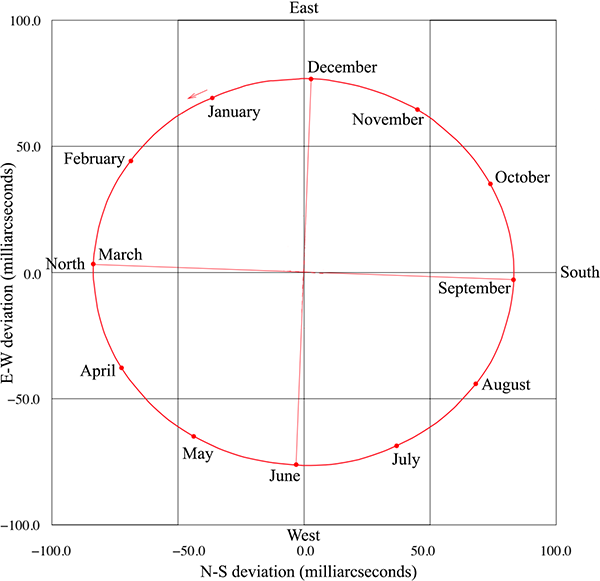
1. An annual elliptical wobble. Over the period of a year, the Earth’s poles move around in an ellipse, with the long axis of the ellipse about 6 metres in length. In March, the North Pole is about 6 metres from where it is in September (though see below). This motion is generally agreed by scientists to be caused by the annual shift in air pressure between winter and summer over the northern and southern hemispheres. In particular there is an imbalance between the Northern Atlantic ocean and Asia, with higher air pressure over the ocean in the northern winter, but higher air pressure over the Asian continent in summer. This change in the mass distribution of the atmosphere is enough to cause the observed wobble.

Annual wobble of North Pole

Annual elliptical wobble of the Earth’s North Pole. Deviation is given in milliarcseconds of axial tilt; 100 milliarcseconds corresponds to a bit over 3 metres at ground level. (Figure adapted from [1].)

2. Superimposed on the annual elliptical wobble is another, circular, wobble, with a period of around 433 days. This is called the Chandler wobble, named after its discoverer, American astronomer Seth Carlo Chandler, who found it in 1891. The Chandler wobble occurs because the Earth is not a perfect sphere. The Earth is slightly elliptical, with the radius at the equator about 20 kilometres larger than the polar radius. When elliptical objects spin, they experience a slight wobble in the rotation known as free nutation. This is the sort of wobble seen in a spinning rugby ball or American football in flight (where the effect is exaggerated by the ball’s exaggerated elliptical shape). This wobble would die away over time, but is driven by changes in the mass distribution of cold and warm water in the oceans and high and low pressure systems in the atmosphere. The Chandler wobble has a diameter of about 9 metres at the poles.

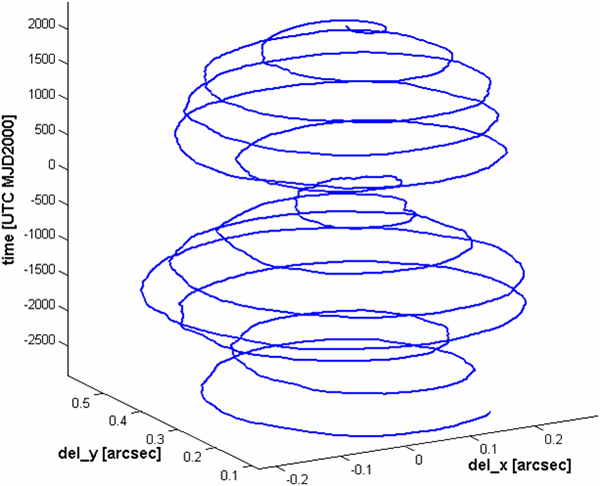
The combined effect of the annual wobble and the Chandler wobble is that the North and South Poles move in a spiralling pattern, sometimes circling with a diameter up to 15 metres, then reducing down to about 3 metres, before increasing again. This beat pattern occurs over a period of about 7 years.

Annual _ Chandler wobble of North Pole

Graph showing the movement of the North Pole over a period of 4500 days (12.3 years), with time on the vertical axis and the spiralling motion mapped in the x and y axes. The motion tickmarks are 0.1 arcsecond in rotation angle of the axis apart, corresponding to about 3 metres of motion along the ground at the Pole. (Public domain image from Wikimedia Commons.)

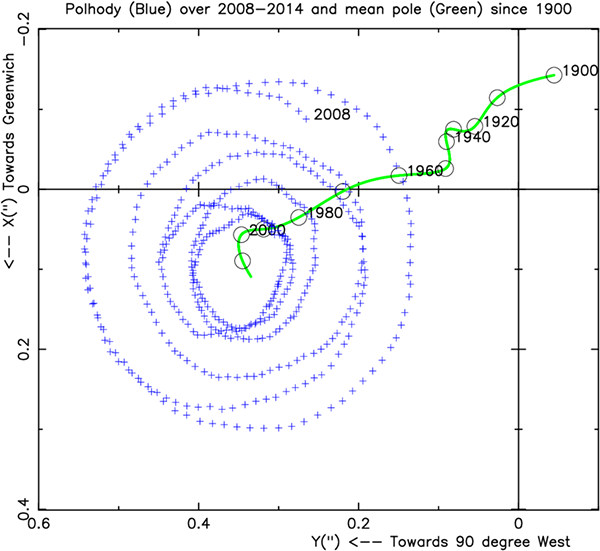
3. The third and final motion of the Earth’s poles is a systematic drift, of about 200 millimetres per year. Since 1900, the central point of the spiral wobbles of the North Pole has drifted by about 20 metres. This drift is caused by changes in the mass distribution of Earth due to shifts in its structure: movement of molten rock in the mantle, isostatic rebound of crust following the last glacial period, and more recently the melting of the Greenland ice sheet. The melting of the Greenland ice sheet in the last few decades has shifted the direction of polar drift dramatically; one of the serious indications of secondary changes to the Earth caused by human-induced climate change. Changes in Earth’s mass distribution alter its rotational moment of inertia, and the rotational axis adjusts to conserve angular momentum.

Motion of North Pole since 1900

Plot of motion of the North Pole since 1900. The actual position of the Pole from 2008 to 2014 is shown with blue crosses, showing the annual and Chandler wobbles. The mean position (i.e. the centre of the wobbles) is shown for 1900 to 2014 as the green line. The pole has mostly drifted towards the 80° west meridian, but has changed direction dramatically since 2000. (Figure reproduced from [2].)

Each of the three components of Earth’s polar motion are: (a) observable with 19th century technology, (b) accurately measurable using current technology, and (c) understandable and quantitatively explainable using the fact that the Earth is a rotating spheroid and our knowledge of its structure.

If the Earth were flat, it would not be possible to reconcile the changes in position of the North and South Poles with the known shifts in mass distribution of the Earth. The Chandler wobble would not even have any reason to exist at close to its observed period unless the Earth was an almost spherical ellipsoid.

References:

[1] Höpfner, J. “Polar motion at seasonal frequencies”. Journal of Geodynamics, 22, p. 51-61, 1996. https://doi.org/10.1016/0264-3707(96)00012-9

[2] Dick, W., Thaller, D. IERS Annual Report 2013. International Earth Rotation Service, 2014. https://www.iers.org/IERS/EN/Publications/AnnualReports/AnnualReport2013.html