Parallax of the moon, experiment update

With Proof 45 I asked readers if they would help perform an experiment to measure the parallax of the moon, and so derive a figure for the radius of the Earth. The experiment was more demanding than when we used Eratosthenes’ method, requiring helpers to stay up for much of the night and take specific photos of the moon and stars. Unfortunately this meant that only two readers contacted me to help perform the experiment, which simply isn’t enough to do it successfully, given the vagaries of weather. (The planned day was rainy here so I couldn’t be a third observer.)

So we don’t have any results to report. I may try this experiment again some time in the future, but I’ll need a significantly higher response from readers if we’re to get it to work.

45. Parallax of the moon

If you hold your arm outstretched before you with a finger raised in front of some object in the distance, and you close one eye and align your finger so that it looks directly in front of a particular object, then close that eye and open the other eye, then your finger will appear to have moved sideways. This is because your left eye and your right eye are not in the same position, so lining up your finger with an object using one eye means that it is not aligned with the other eye. This effect is known as parallax.

Parallax is a purely geometric effect, caused by the divergence of straight lines drawn from a common object to two different viewpoints. We make use of parallax unconsciously, our brains using the different visual information from our two eyes to give us the sensation of viewing a three dimensional world around us.

We’ve discusses parallax briefly in Proof 28: Stereo imaging. Here’s a repeat of the diagram illustrating parallax (with a dog instead of a finger).

Illustration of parallax

Illustration of parallax. The dog is closer than the background scene. Sightlines from your left and right eyes passing through the dog project to different areas of the background. So the view seen by your left and right eyes show the dog in different positions relative to the background. (The effect is exaggerated here for clarity.)

Parallax can be observed wherever you look at two objects at different distances. If you measure the distance between the two viewpoints and the angle between the two different sightlines, and you know the distance to one of the objects, then by simple geometry you can calculate the distance to the other object. A handy approximation is that if one object is much further away than the near object, then you can assume it is infinitely far away, which simplifies the geometry and produces only a negligibly small error.

Parallax can be used in this way to measure the distance to some astronomical objects, namely those objects close enough to Earth to have a measurable parallax angle when compared to the positions of distant stars. This includes objects in our solar system, as well as the very nearest stars. The European Space Agency satellite Hipparcos measured parallaxes of around 100,000 stars, using observations made six months apart so that the two different viewpoints are on opposite sides of the Earth’s orbit, a viewpoint separation baseline of 300 million km. Even with this enormous baseline, the parallax angle of stars is less than one second of arc, requiring precise instruments to even detect. However, there is a much closer celestial object for which the parallax is readily visible with a smaller baseline: the moon.

The moon is not close enough to see parallax from your left and right eyes. It is however close enough that photos of the moon taken from different locations on the Earth at the same time show the moon significantly shifted against the background of stars. With viewpoints on opposite sides of the Earth, the parallax angle of the moon is about one degree – it varies slightly due to the moon’s elliptical orbit.

Illustration of parallax

Illustration of parallax of the moon, as seen from four different points on the Earth’s surface at the same time. Viewed from the North Pole, the moon occults stars in the constellation of Pleiades, but viewed from other locations the moon does not occult the same stars. (Public domain image from Wikimedia Commons.)

Using such observations of the moon, and knowing how far apart the viewpoints are, you can calculate the distance to the moon with high accuracy. But you can also do the reverse calculation: if you know the distance to the moon, you can calculate how far apart the viewpoint locations are. As mentioned in Proof 32: Satellite laser ranging, we have an independent method of measuring the distance to the moon, to an accuracy of better than a millimetre, by bouncing lasers off reflectors left on the moon by the Apollo astronauts. Before 1969, we could also measure the distance to the moon using radar ranging, to an accuracy of about 1 km.[1][2]

Incidentally, the 1965 paper by Yaplee, et al.[2], also includes a calculation of the radius of the Earth from the radar ranging data, as it comes out as a variable that can be solved for if you know the acceleration due to gravity at Earth’s surface and the ratio of the Earth’s mass to the moon’s mass, which were known at the time. Given their radar results, the authors calculate the Earth’s equatorial radius to be 6378.167 km, only 30 metres different to the current reference value of 6378.137 km. (Obviously a result unobtainable if you assume the Earth is flat.)

Illustration of parallax

Diagram from Yaplee, et al., showing the geometry of the Earth-moon system for the purpose of determining the distance to the moon using radar ranging. (Figure reproduced from [2].)

So even without using parallax we know the distance to the moon. This means we can do the reverse calculation, and figure out how far apart different viewpoints (such as the North Pole and South Pole) are. Any two antipodal points, on opposite sides of the Earth, are about 20,000 km apart – as the crow flies, or as a traveller would have to cover to go from one point to the other. However if you calculate how far apart those points are using lunar parallax, you find that they are actually about 12,730 km apart. Why such a big discrepancy?

The simplest explanation for this is that the Earth’s surface is curved, with 20,000 km representing the semi-circumference and 12,730 km being the diameter (twice the radius) of curvature. If the Earth were flat, then the calculated distance between two points for which the travel distance is 20,000 km would also have to be 20,000 km.

Experiment:

With your help, we can perform a lunar parallax experiment to see if the Earth is flat or not, and to measure its radius if we assume it’s spherical. All we need to do is take some photos of the moon and the background stars at the same time, from different places around the world. The best time to do this is when the moon is up most of the night, which means a full moon. The next full moon after this is published occurs on 31 October 2020 at 14:49 UTC. This means the night of 31 October-1 November is perhaps the best time to do this. However I will be travelling that night and unable to participate myself, and perhaps many people will be busy with Halloween activities. So I propose we do it on the following night: the evening of 1 November into the morning of 2 November. This has the slight advantage that the moon rises and sets a bit later, meaning it will be easier for people to get a photo just before sunrise, which is vitally important as I shall explain.

I could set one specific time for everyone to take photos, but that would not be ideal, because half the planet won’t be able to see the moon at the given time, and there will also be places where the moon is up, but it will be too light to see stars. So instead, we will take photos on the hour, every hour, for as much of the night as you can manage. For this to provide useful data, the photos must satisfy the following conditions:

1. We absolutely must have some photos taken in the midnight-to-sunrise period, and preferably some taken just before sunrise (e.g. 4 or 5 a.m.). This is so they can be matched with photos taken in the evening in different time zones. If everyone just takes a few photos in the evening and goes to bed, this won’t work. It’s better if you take a shot before going to bed, and then drag yourself out of bed for another shot before sunrise. I realise not everybody will want to do this, but at least some of you will need to. If you really can’t manage it, please stay up as late as possible and shoot every hour until you do go to bed.

2. Stars must be visible in the photos. Enough stars that we can recognise the constellations, not just 3 or 4 stars. This means you will need to overexpose the moon quite severely. That’s fine, we’re not interested in seeing details of the moon, as long as we can figure out where the middle of the moon is. This means you shouldn’t zoom right into the moon – a moderate focal length lens will work fine, around 50-100 mm for a 35 mm camera. Go out some night beforehand and practice taking a photo of stars to figure out the correct exposure.

Some example photos that would be fine for this experiment:

If you’re interested in taking photos for this experiment, please contact me (dmm [at] dangermouse.net) to register your interest, with your location and a list of hours that you would be willing to be awake to take photos. Maybe send me a sample photo you’ve taken showing stars. I’ll coordinate the list and make sure we have enough people to make the experiment worthwhile, and will let everyone know a few days beforehand whether we will go ahead, or if we should postpone the date until we get more people. And if we do go ahead, what hours will be most valuable for you to take photos.

References:

[1] Yaplee, B. S., Bruton, R. H., Craig, K. J., Roman., N. G. “Radar echoes from the moon at a wavelength of 10 cm.” Proceedings of the Institute of Radio Engineers, 46(1), p. 293-297, 1958. https://doi.org/10.1109/JRPROC.1958.286790

[2] Yaplee, B. S., Knowles, S. H., Shapiro, A., Craig, K. J., Brouwer, D. “The mean distance to the Moon as determined by radar.” In Symposium-International Astronomical Union, 21, p. 81-93, Cambridge University Press, 1965. https://doi.org/10.1017/S0074180900104826

43. The Schiehallion experiment

The Ancients had the technology and cleverness to work out the shape of the Earth and its diameter (see 2. Eratosthenes’ measurement). However, they had no reliable method to measure the mass of the Earth, or equivalently its density, which gives the mass once you know the volume. You could assume that the Earth has a density similar to rock throughout, but there was no way of knowing if that was correct.

In fact we had no measurement of the density or mass of the Earth until the 18th century. Perhaps surprisingly, there wasn’t even any observational evidence to decide whether the Earth was actually a solid object, or a hollow shell with a relatively thin solid crust. As late as 1692 the prominent scientist Edmond Halley proposed that the Earth might be composed of a spherical shell around 800 km thick, with two smaller shells inside it and a solid core, all separated by a “luminous” atmosphere (which could escape and cause the aurora borealis).

Edmond Halley's hollow Earth model

Structure of the Earth as proposed by Edmond Halley in 1692, with solid shells (brown) separated by a luminous atmosphere, shown in cross section.

In his 1687 publication of Philosophiæ Naturalis Principia Mathematica, Isaac Newton presented his theory of universal gravitation. Although this provided explicit equations relating the physical properties of gravitational force, mass, and size, for the cases of astronomical objects there were still more than one unknown value, so the equations could not be solved to determine the absolute masses or densities of planets. The best astronomers could do was determine ratios of densities of one planet to another.

But Newton not only proposed his formulation of gravity as a theoretical construct – he also suggested a possible experiment that could be done to test it. As observed by common experience, objects near the surface of the Earth fall downwards – they are attracted towards the centre of the Earth (more precisely, the Earth’s centre of mass). But if the attractive force of gravity is generated by mass as per Newton’s formulation, then unusual concentrations of mass should change the direction of the gravitational pull a little.

We’ve already seen in Proof 24. “Gravitational acceleration variation” that the strength of Earth’s gravitational pull varies across the Earth’s surface due to differences in altitude and density within the Earth. Now imagine a large concentration of mass on the surface of the Earth. If Newton is correct, then such a mass should pull things towards it. The attraction to the centre of the Earth is much stronger, so the direction of the overall gravitational pull should still be almost downwards, but there should be a slight deflection towards the large mass.

There are some convenient large masses on the surface of the Earth. We call them mountains. Newton conceived that one could go somewhere near a large mountain and measure the difference in angle between a plumb line (which indicates the direction of gravity, and is commonly called “vertical”) and a line pointing towards the Earth’s centre of mass (which does not have a well-defined name, since it is more difficult to measure and differs from a plumb line by an amount too small to be significant in engineering or construction – for the purposes of this proof only, I shall abbreviate it to “downwards”). However, Newton believed that any such difference would be too small to measure in practice. He writes in the Principia, Book 3: On the system of the world:

Hence a sphere of one foot in diameter, and of a like nature to the earth, would attract a small body placed near its surface with a force 20,000,000 times less than the earth would do if placed near its surface; but so small a force could produce no sensible effect. If two such spheres were distant but by 1/4 of an inch, they would not, even in spaces void of resistance, come together by the force of their mutual attraction in less than a month’s time; and lesser spheres will come together at a rate yet slower, namely in the proportion of their diameters. Nay, whole mountains will not be sufficient to produce any sensible effect. A mountain of an hemispherical figure, three miles high, and six broad, will not, by its attraction, draw the pendulum two minutes out of the true perpendicular; and it is only in the great bodies of the planets that these forces are to be perceived.[1]

Here is where Newton’s lack of experience as an experimentalist let him down. Two minutes of arc was already within the accuracies of stellar positions claimed by Tycho Brahe some 80 years earlier. If Newton had merely asked astronomers if they could measure a deflection of such a small size, they would likely have answered yes.

Tycho Brahe in his observatory at Uraniborg

Engraving of Tycho Brahe observing in his observatory at Uraniborg, Sweden. (Public domain image from Wikimedia Commons.)

If you can measure how big the deflection angle is with sufficient accuracy, then you can use that measurement to calculate the density of the Earth in terms of the density of the mountain:

ρE/ρM = (VM/VE) (rE/d)2 / tan θ

where:

ρE is the density of the Earth,
ρM is the density of the mountain,
VE is the volume of the Earth,
VM is the volume of the mountain,
rE is the radius of the Earth,
d is the horizontal distance from the centre of the mountain to the plumb bob, and
θ is the angle of deflection of the plumb line from “downwards”.

The volume of the mountain can be estimated from its size and shape, and the density may be assumed to be that of common types of rock. All the other values were known, leaving the as yet unknown density of the Earth as a function of the deflection angle.

Two French astronomers, Pierre Bouguer (who we met in 4. Airy’s coal pit experiment) and Charles Marie de La Condamine, were the first to attempt to make the measurement. In 1735 they led an expedition to South America to measure the length of an arc of one degree of latitude along a line of longitude near the equator. This was part of an experiment by the French Academy of Sciences—along with simultaneous expedition to Lapland to make a similar measurement near the North Pole—to measure the shape of the Earth. Not whether it was spherical; any difference between the measurements would show if it was more accurately a prolate or an oblate ellipsoid.

Bouguer and La Condamine spent ten years on their expedition, making many other physical, geographical, biological, and ethnographical studies. One experiment they tried in 1738 was measuring the deflection of a plumb bob near the 6263 metre high volcano Chimborazo, in modern day Ecuador.

Chimborazo in Ecuador

The volcano Chimborazo in Ecuador. (Creative Commons Attribution 2.0 image by David Ceballos, from Flickr.)

They climbed to an altitude of 4680 m on one flank of the mountain and 4340 m on the other side, battling harsh weather to take the two measurements. Taking two measurements on opposite sides of the mountain allows a subtraction to remove sources of error in locating the “downwards” direction, leaving behind the difference in angle between the two plumb bob directions, which is twice the desired deflection. Bouguer and La Condamine measured a deflection of 8 seconds of arc, however they considered the circumstances so difficult as to render it unreliable. But they did state that this measurement gave a large value for the Earth’s density, thus disproving the hypothesis that the Earth was hollow.

A more precise measurement of the gravitational deflection of a mountain had to wait until 1772, when Astronomer Royal Nevil Maskelyne made a proposal to repeat the experiment to the Royal Society of London.[2] The Society approved, and appointed the quaintly named Committee of Attraction to ponder the proposal. The committee (counting Joseph Banks and Benjamin Franklin among its members) despatched astronomer and surveyor Charles Mason (of Mason-Dixon line fame) to find a suitable mountain. He came back with Schiehallion, a 1083 m peak in central Scotland.

Schiehallion in Scotland

Schiehallion in central Scotland. (Creative Commons Attribution 3.0 Unported image by Wikipedia user Andrew2606, from Wikimedia Commons.)

Schiehallion had several advantages for the measurement. It’s conveniently located for a British expedition. It’s an isolated peak, with no other mountains nearby that could substantially complicate the effects of gravity in the region. It has a very symmetrical shape, making it easy to estimate the volume with some accuracy. And the northern and southern slopes are very steep, which means that by doing the experiment on those sides, the plumb bob can be positioned relatively close to the centre of mass of the mountain, increasing the deflection and making it easier to measure.

Maskelyne himself led the expedition, taking temporary leave from his post as Astronomer Royal. The party built temporary observatories on the northern and southern flanks of Schiehallion, from which they made frequent observations of overhead stars to determine the zenith line (marking the “downwards” direction), so they could compare it to the direction of the hanging plumb line. Maskelyne and his team spent 6 weeks at the southern observatory, followed by 10.5 weeks at the northern one, battling inclement weather to take the required number of observations.[3]

Map of Schiehallion and surrounds

Map of Schiehallion and surrounds. The mountain forms a short ridge running approximately east-west. The positions of the north and south observatories can be seen. (Reproduced from [6].)

Maskelyne had calculated that if the Earth as a whole had the same density as the mountain (i.e. that of quartzite rock), then they should have observed a deflection of the plumb line relative to “downwards” of 20.9 seconds of arc. Preliminary calculations showed a deflection of about half that, meaning the Earth was roughly twice as dense as the mountain.

To mark the successful conclusion of the observations, the expedition celebrated with a rollicking good party. Plenty of alcohol was imbibed (quite possibly Scotch whisky). In the revelry, unfortunately someone accidentally set fire to the northern observatory and it burnt to the ground. The fire claimed the violin of one Duncan Robertson, a junior member of the expedition who had helped to pass the long cold nights of observation by entertaining the other members with his playing. Later, a grateful Maskelyne sent Robertson a replacement violin – not just any violin, but one made by the master craftsman Antonio Stradivari.[4][5]

The mathematician and surveyor Charles Hutton was charged with doing the detailed calculations of the result. He published them in a mammoth 100-page paper in 1778.[6] His final conclusion was that the density of the Earth was 1.8 times the density of the quartzite in Schiehallion, or about 4.5 g/cm3. Since this was so much higher than the densities of various types of rock (typically between 2 and 3 g/cm3), Hutton concluded (correctly) that much of the core of the Earth must be metal, and he calculated that about 65% of the Earth’s diameter must be a metallic core (a little higher than current measurements of 55%).
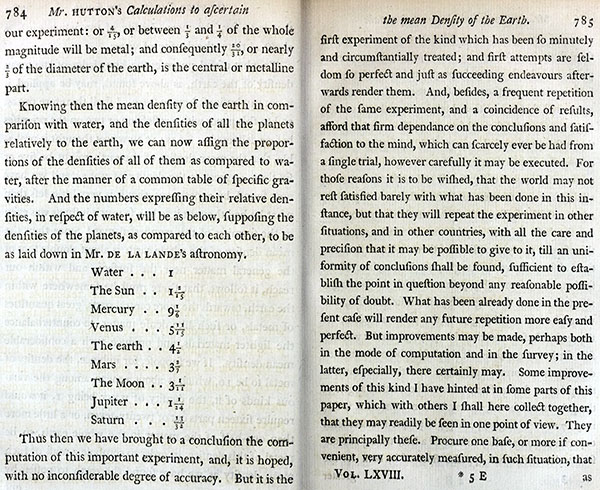
Hutton's conclusions on the structure of Earth and density of planets

Extract of Hutton’s paper, where he states that roughly 2/3 of the diameter of the Earth must be metallic to account for the measured density. This page also shows Hutton’s calculations of the densities of solar system bodies. (Reproduced from [6].)

This was the very first time that we had any estimate of the density/mass of the Earth, and Hutton also used it to calculate the densities of the Sun, the Moon, and the planets (out to Saturn) based on their known astronomical properties, mostly to within about 20% of the modern values. So the Schiehallion experiment was groundbreaking and significantly increased our fundamental understanding of the Earth and the solar system.

Later experiments confirmed the general nature of the result and refined the figures for the density and structure of the Earth. In particular, Henry Cavendish—a chemist who 20 years earlier had discovered the elemental nature of hydrogen and made several other discoveries about air and elemental gases—turned his attention to physics and performed what has become known as the Cavendish experiment in 1797-98. He constructed a finely balanced mechanism with which he could measure the tiny gravitational attractive force between two balls of lead, which allowed the measurement of the (then unknown) value of Newton’s gravitational constant. Knowing this value, it becomes possible to directly plug in values for the size of the Earth and the acceleration due to gravity and determine the mass of the Earth. Cavendish’s result was accurate to about 1%, confirming Hutton’s conclusion that the Earth must have a core denser than rock. And then in the 20th century, seismology allowed us to confirm the existence of discrete layers within the Earth, with the central core made primarily of metal (a story for a future Proof).

Drawing of Henry Cavendish

Drawing of Henry Cavendish. (Creative Commons Attribution 4.0 International image by the Wellcome Collection of the British Library, from Wikimedia Commons.)

Of course, the conclusions of the Schiehallion experiment—consistent with later experiments using independent methods—depend on the fact that the Earth is very close to spherical, and the fact that gravity works as Newton said (disregarding the later refinement by Einstein, which is not significant here). One of the more popular Flat Earth models assumes that gravity does not even exist as a force, and that objects “fall” to Earth because the Flat Earth is actually accelerating upwards. In such a model, objects always fall directly “downwards” and there is no deflection caused by large masses such as mountains. The Schiehallion experiment directly and simply disproves this Flat Earth model.

If we suppose that a Flat Earth somehow manages to exist with Newtonian gravity (in itself virtually impossible, see 13. Hydrostatic equilibrium), we could posit something like the 859 km thick flat disc mentioned in 34. Earth’s internal heat. Firstly, Newtonian gravity on such a disc would not always pull perpendicular to the ground – inhabitants near the circumference would be pulled at a substantial angle towards the centre of the disc. Ignoring this, if you managed to do the Schiehallion experiment (say at the North Pole), the distance rE in the equation would be effectively 430 km (the distance to the centre of mass of the disc) rather than the radius of the spherical Earth, 6378 km. This should make the observed deflection angle approximately (6378/430)2 = 220 times smaller! Then the observed deflections would imply that the density of the Earth is 220 times higher, or around 990 g/cm3, about 6 times as dense as the core of the Sun. Which is then inconsistent with the assumed density being the same as the spherical Earth (among other problems).

On the other hand, if we allow the density to be a free parameter, we can solve the gravitational and geometric equations simultaneously to derive the thickness of the Flat Earth disc in a “consistent” manner. This produces a thickness of 3020 km, and a density of 92 g/cm3. Which is over 4 times as dense as osmium, the densest substance at non-stellar pressures. So we’ve shown that the Schiehallion experiment proves that this “Newtonian Flat Earth” model cannot possibly be composed of any known material.

Basically, the observations of the Schiehallion experiment cannot be made consistent with a flat Earth, thus providing evidence that the Earth is a globe.

References:

[1] Newton, I. Philosophiae Naturalis Principia Mathematica (1687). Trans. Andrew Motte, 1729.

[2] Maskelyne, N. “A proposal for measuring the attraction of some hill in this Kingdom”. Philosophical Transactions of the Royal Society, 65, p. 495-499, 1772. https://doi.org/10.1098/rstl.1775.0049

[3]. Sillitto, R.M. “Maskelyne on Schiehallion: A Lecture to The Royal Philosophical Society of Glasgow”. 1990. http://www.sillittopages.co.uk/schie/schie90.html

[4] Davies, R. D. “A Commemoration of Maskelyne at Schiehallion”. Quarterly Journal of the Royal Astronomical Society, 26, p. 289, 1985. https://ui.adsabs.harvard.edu/abs/1985QJRAS..26..289D

[5] Danson, E. Weighing the World. Oxford University Press, 2005. ISBN 978-0-19-518169-2.

[6] Hutton, C. “An Account of the Calculations made from the Survey and Measures taken at Schehallien, in order to ascertain the mean Density of the Earth”. Philosophical Transactions of the Royal Society. 68, p. 689-788, 1778. https://doi.org/10.1098/rstl.1778.0034

36. The visible stars

When our ancestors looked up into the night sky, they beheld the wonder of the stars. With our ubiquitous electrical lighting, many of us don’t see the same view today – our city skies are too bright from artificial light (previously discussed under Skyglow). We can see the brightest handful of stars, but most of us have forgotten how to navigate the night sky, recognising the constellations and other features such as the intricately structured band of the Milky Way and the Magellanic Clouds. There are features in the night sky other than stars (the moon, the planets, meteors, and comets), but we’re going to concentrate on the stars.

The night sky, showing the Milky Way

Composite image of the night sky from the European Southern Observatory at Cerro Paranal, Chile, showing the Milky Way (bright band) and the two Magellanic Clouds (far left). (Creative Commons Attribution 4.0 International image by the European Southern Observatory.)

The Milky Way counts because it is made of stars. To our ancestors, it resembled a stream of milk flung across the night sky, a continuous band of brightness. But a small telescope reveals that it is made up of millions of faint stars, packed so closely that they blend together to our naked eyes. The Milky Way is our galaxy, a collection of roughly 100 billion stars and their planets.

The stars are apparently fixed in place with respect to one another. (Unlike the moon, planets, meteors, and comets, which move relative to the stars, thus distinguishing them.) The stars are not fixed in the sky relative to the Earth though. Each night, the stars wheel around in circles in the sky, moving over the hours as if stuck to the sky and the sky itself is rotating.

The stars move in their circles and come back to the same position in the sky approximately a day later. But not exactly a day later. The stars return to the same position after 23 hours, 56 minutes, and a little over 4 seconds, if you time it precisely. We measure our days by the sun, which appears to move through the sky in roughly the same way as the stars, but which moves more slowly, taking a full 24 hours (on average, over the course of a year) to return to the same position.

This difference is caused by the physical arrangement of the sun, Earth, and stars. Our Earth spins around on its axis once every 23 hours, 56 minutes, and 4 and a bit seconds. However in this time it has also moved in its orbit around the sun, by a distance of approximately one full orbit (which takes a year) divided by 365.24 (the average number of days in a year). This means that from the viewpoint of a person on Earth, the sun has moved a little bit relative to the stars, and it takes an extra (day/365.24) = 236 seconds for the Earth to rotate far enough for the sun to appear as though it has returned to the same position. This is why the solar day (the way we measure time with our clocks) is almost 4 minutes longer than the Earth’s rotation period (called the sidereal day, “sidereal” meaning “relative to the stars”).

Sidereal and solar days

Diagram showing the difference between a sidereal day (23 hours, 56 minutes, 4 seconds) when the Earth has rotated once, and a solar day (24 hours) when the sun appears in the same position to an observer on Earth.

Another way of looking at is that in one year the Earth spins on its axis 366.24 times, but in that same time the Earth has moved once around the sun, so only 365.24 solar days have passed. The sidereal day is thus 365.24/366.24 = 99.727% of the length of the solar day.

The consequence of all this is that slowly, throughout the year, the stars we see at night change. On 1 January, some stars are hidden directly behind the sun, and we can’t see them or nearby stars, because they are in the sky during the day, when their light is drowned out by the light of the sun. But six months later, the Earth is on the other side of its orbit, and those stars are now high in the sky at midnight and easily visible, whereas some of the stars that were visible in January are now in the sky at daytime and obscured.

This change in visibility of the stars over the course of a year applies mostly to stars above the equatorial regions. If we imagine the equator of the Earth extended directly upwards (a bit like the rings of Saturn) towards the stars, it defines a plane cutting the sky in half. This plane is called the celestial equator.

However the sun doesn’t move along this path. The Earth’s axis is tilted relative to its orbit by an angle of approximately 23.5°. So the sun’s apparent path through the sky moves up and down by ±23.5° over the course of a year, which is what causes our seasons. When the sun is higher in the sky it is summer, when it’s lower, it’s winter.

So as well as the celestial equator, there is another plane bisecting the sky, the plane that the sun appears to follow around the Earth – or equivalently, the plane of the Earth’s (and other planets’) orbit around the sun. This plane is called the ecliptic. It’s the stars along and close to the ecliptic that appear the closest to and thus the most obscured by the sun throughout the year.

Celestial equator and ecliptic plane

Diagram of the celestial equator and the ecliptic plane relative to the Earth and sun (sizes and distances not to scale). The Earth revolves around the sun in the ecliptic plane. (Adapted from a public domain image by NASA, from Wikimedia Commons.)

The constellations of the ecliptic have another name: the zodiac. We’ve met this term before as part of the name of the zodiacal light. The zodiacal light occurs in the plane of the planetary orbits, the ecliptic, which is the same as the plane of the zodiac. As an aside, the constellations of the zodiac include those familiar to people through the pre-scientific tradition of Western astrology: Aries, Taurus, Gemini, Cancer, Leo, Virgo, Libra, Scorpius (“Scorpio” in astrology), Ophiuchus (ignored in astrology), Sagittarius, Capricornus (“Capricorn” in astrology), Aquarius, and Pisces. The system of astrology abstracts these real-world constellations into 12 idealised segments of the sky, each covering exactly 30° of the circle (in fact the constellations cover different amounts), and assigns portentous meanings to the positions of the sun, moon, and planets within each segment.

The stars close to the zodiac are completely obscured by the sun for part of the year, while the stars near the celestial equator appear close to the sun but might still be visible (with difficulty) immediately after sunset or before dawn. The stars far from these planes, however, are more easily visible throughout the whole year. The north star, Polaris, is almost directly above the North Pole, and it and stars nearby are visible from most of the northern hemisphere year-round. There is no equivalent “south pole star”, but the most southerly constellations—such as the recognisable Crux, or Southern Cross—are similarly visible year-round through most of the southern hemisphere.

Axial tilt of Earth

Diagram showing the axial tilt of the Earth relative to the plane of the orbit (the ecliptic), and the positions of Polaris and stars in the zodiac and on the celestial equator. Sizes and distances are not to scale – in reality Polaris is so far away that the angle it makes between the June and December positions of Earth is only 0.007 seconds of arc (about a five millionth of a degree).

Interestingly, Polaris is never visible from the southern hemisphere. Similarly, Crux is not visible from almost all of the northern hemisphere, except for a band close to the equator, from where it appears extremely low on the southern horizon. Crux is centred around 60° south, celestial latitude (usually known as declination), which means that it is below the horizon from all points north of latitude 30°N. (In practice, stars near the horizon are obscured by topography and the long path through the atmosphere, so it is difficult to spot Crux from anywhere north of about 20°N.)

In general, stars at a given declination can never be seen from Earth latitudes 90° or more away, and only with difficulty from 80°-90° away. The reason is straightforward enough. From our spherical Earth, if you are standing at latitude x°N, all parts of the sky from (90-x)°S declination to the south celestial pole are below the horizon. And similarly if you’re at x°S, all parts of the sky from (90-x)°N declination to the north celestial pole are below the horizon. The Earth itself is in the way.

On the other hand, if you are standing at latitude x°N, all parts of the sky north of the same declination are visible every night of the year, while stars between x°N and (90-x)°S are visible only at certain times of the year.

Visibility of stars from globe Earth

Visibility of stars from parts of Earth is determined simply by sightlines from the surface of the globe.

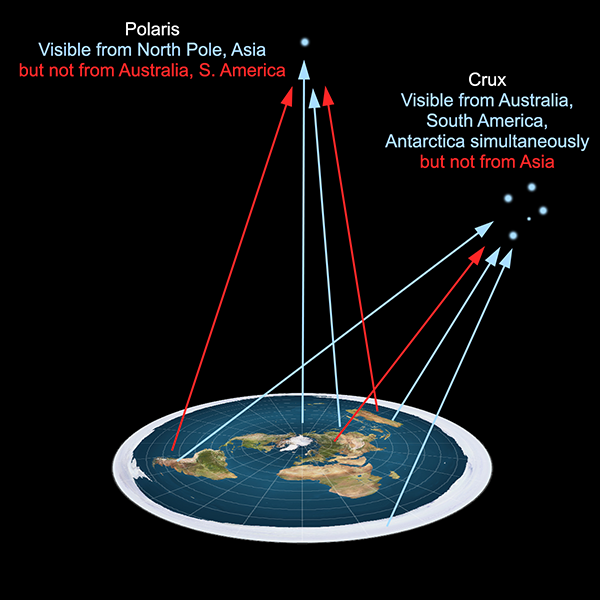
With a spherical Earth, the geometry of the visibility of stars is readily understandable. On a flat Earth, however, there’s no obvious reason why some stars would be visible from some parts of the Earth and not others, let alone the details of how the visibilities change with latitude and throughout the year.

If we consider the usual flat Earth model, with the North Pole at the centre of a disc, and southern regions around the rim, it is difficult to imagine how Polaris can be seen from regions north of the equator but not south of it. And it is even more difficult to justify how it is even possible for southern stars such as those in Crux being visible from Australia, southern Africa, and South America but not from anywhere near the centre of the disc. The southern stars can be seen in the night sky from any two of these locations simultaneously, but if you use a radio telescope during daylight you can observe the same stars from all three at once. Things get even worse with Antarctica. In the southern winter, it is night at virtually every location in Antarctica at the same time, and many of the same stars are visible, yet cannot be seen from the northern hemisphere.

Visibility of stars from flat Earth

Visibility of stars from a flat Earth. All stars must be above the plane, but why are some visible in some parts of the world but not others? Particularly the southern stars, which can be seen from widely separated locations but not regions in the middle of them.

In any flat Earth model, there should be a direct line of sight from every location to any object above the plane of the Earth. To attempt to explain why there isn’t requires special pleading to contrived circumstances such as otherwise undetectable objects blocking lines of sight, or light rays bending or being dimmed in ways inconsistent with known physics.

The fact that when you look up at night, you can’t see all the stars visible from other parts of the Earth, is a simple consequence of the fact that the Earth is a globe.

17. Light time corrections

In the 16th century, the naval powers of Europe were engaged in a race to explore and colonise lands previously unknown to Europeans (though many were of course already inhabited), and reap the rewards of the new found resources. They were limited by the accuracy of navigation at sea. Determining latitude was a relatively simple matter of sighting the angle of a star or the sun through a sextant. But because of the daily rotation of the Earth, determining the longitude by sighting a celestial object required knowing the time of day. Mechanical clocks of the era were rendered useless by the rocking of a ship, making this a major problem.

Solving the problem would give such an advantage to the country holding the secret that in 1598 King Philip III of Spain offered a prize of 6000 ducats plus an annual pension of 2000 ducats for life to whoever could devise a means of measuring longitude at sea. In 1610 the prize was still unclaimed, and in that year Galileo Galilei trained his first telescope on Jupiter, becoming the first person to observe the planet’s largest four moons. He studied their movements, and a couple of years later had produced orbital tables that allowed their positions to be calculated months or years in advance. These tables included the times when a moon would slip into Jupiter’s shadow, and be eclipsed, disappearing from view because it no longer reflected sunlight.

Galileo wrote to King Philip in 1616, proposing a method of telling the time at sea by observing the eclipses of Jupiter’s moons. One could pinpoint the time by observing an eclipse, and then use an observation of a star to calculate the longitude. Although the method could work in principle, observing an eclipse of a barely visible object through the narrow field of view of a telescope while standing on a rocking ship was practically impossible, and it never worked in practice.

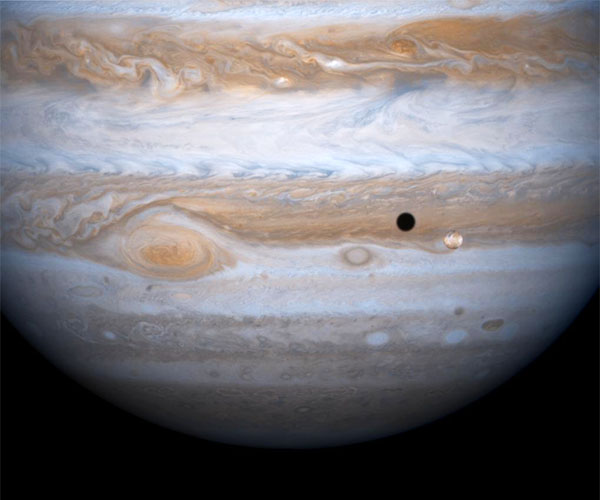
Jupiter and Io

Jupiter and its innermost large moon, Io, as seen by NASA’s Cassini space probe. (Galileo’s view was nowhere near as good as this!) (Public Domain image by NASA.)

By the 1660s, Giovanni Cassini had developed Galileo’s method as a way of measuring precise longitudes on land, as an aid to calculating distances and making accurate maps. In 1671 Cassini moved to take up directorship of the Royal Observatory in Paris. He dispatched his assistant Jean Picard to Uraniborg, the former observatory of Tycho Brahe, near Copenhagen, partly to make measurements of eclipses of Jupiter’s moon Io, to accurately calculate the longitude difference between the two observatories. Picard himself employed the assistance of a young Dane named Ole Rømer.

Ole Rømer

Portrait of Ole Rømer by Jacob Coning. (Public domain image from Wikimedia Commons.)

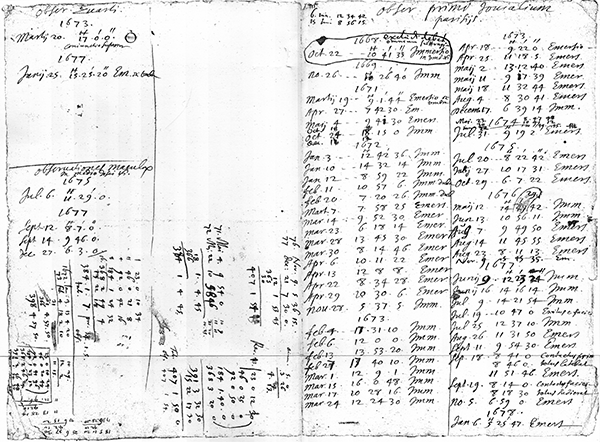
The moon Io orbits Jupiter every 42.5 hours and is close enough to be eclipsed on each orbit, so an eclipse is visible every few days, weather and daylight hours permitting. After observing well over 100 eclipses, Rømer moved to Paris to assist Cassini himself, and continued recording eclipses of Io over the next few years. In these observations Cassini noticed some odd discrepancies. In particular, the time between successive eclipses got shorter when the Earth was approaching Jupiter in its orbit, and longer several months later when the Earth was moving away from Jupiter. Cassini realised that this could be explained if the light from Io did not arrive at Earth instantaneously, but rather took time to travel the intervening distance. When the Earth is closer to Jupiter, the light has less distance to cover, so the eclipse appears to occur earlier, and vice versa: when the Earth is further away the eclipse appears to be later because the light takes longer to reach Earth. Cassini made an announcement to this effect to the French Academy of Sciences in 1676.

Ole Rømer's eclipse notes

Ole Rømer’s notebook showing recordings of the dates and times of eclipses of Io from 1667 to 1677. “Imm” means immersion into Jupiter’s shadow, and “Emer” means emergence from Jupiter’s shadow. (Public domain image from Wikimedia Commons.)

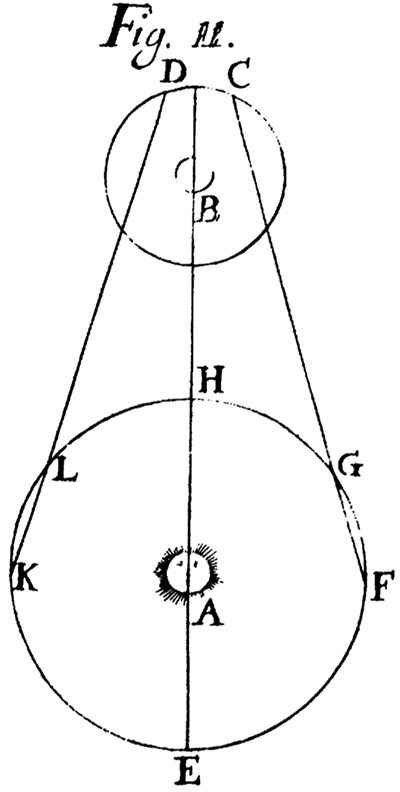
However, it was common wisdom at the time that light travelled instantaneously, and Cassini later retreated from his suggestion and did not pursue it further. Rømer, on the other hand, was intrigued and continued to investigate. In 1678 he published his findings. He argued that as the Earth moved in its orbit away from Jupiter, successive eclipses would each occur with the Earth roughly 200 Earth-diameters further away from Jupiter than the previous one. Using the geometry of the orbit and his observations, Rømer calculated that it must take light approximately 11 minutes to cross a distance equal to the diameter of the Earth’s orbit. This is a little low—it actually takes about 16 and a half minutes—but it’s the right order of magnitude. So for the first time, we had some idea how fast light travels. And as we’ve just seen, the finite speed of light can have a significant effect on the observed timing of astronomical observations.

Ole Rømer's figure

Figure 2 from Rømer’s paper, illustrating the difference in distance between Earth and Jupiter between successive eclipses as Earth recedes from Jupiter (LK) and approaches Jupiter (FG). Reproduced from [1].

The finite speed of light means that astronomical events don’t occur when we see them. We only see the event after enough time has elapsed for the light to travel to Earth. This is important for events with precisely measurable times, such as eclipses, occultations, the brightness variations of variable stars, and the radio pulses of remote pulsars.

Not only do you need to correct for the time it takes light to reach Earth, but the correction is different depending on where you are on Earth. An observer observing an object that is directly overhead is closer to it than an observer seeing the same object on the horizon. The observer seeing the object on the horizon is further away by the radius of the Earth. The radius of the Earth is 6370 km, and it takes light a little over 21 milliseconds to travel this distance. So astronomical events observed on the horizon appear to occur 21 milliseconds later than they do to someone observing the same event overhead. This effect is significant enough to be mentioned explicitly in a paper discussing the timing of variable stars:

“More disturbing effects become significant which require more conventions and more complex reduction procedures. By far the biggest effect is the topocentric light-time correction (up to 20 msec).”[2]

Topocentric refers to measuring from a specific point on the surface of the Earth. Depending where on Earth you are, the timing of observed astronomical events can appear to vary by up to 20 ms.

Not only does the light travel time affect the observed time of astronomical events, it also affects the observed position of some astronomical objects, most importantly solar system objects that move noticeably over the few hours that light takes to travel to Earth from them. When we observe an object such as a planet or an asteroid, we see it in the position that it was when the light left it, not where it is at the time that we see it. So for such objects, a corrected position needs to be calculated. The correction in observed position of a moving astronomical object due to the finite speed of light is, somewhat confusingly, also known as light time correction.

Light time correction of observed position is critical in determining the orbits of bodies such as asteroids and comets with accuracy. A paper describing general methods for determining orbital parameters from observations notes that Earth-based observations are necessarily topocentric, and states in the description of the method that:

“In the case of asteroid or comet orbits, the light-time correction has been computed.”[3]

Finally, a recent paper on determining the orbital parameters of near-Earth objects (which pose a potential threat of catastrophic collision with Earth) points out, where ρ is the topocentric distance:

“Note that we include a light-time correction by subtracting ρ/c from the observed epochs for any propagation computation with c as speed of light.”[4]

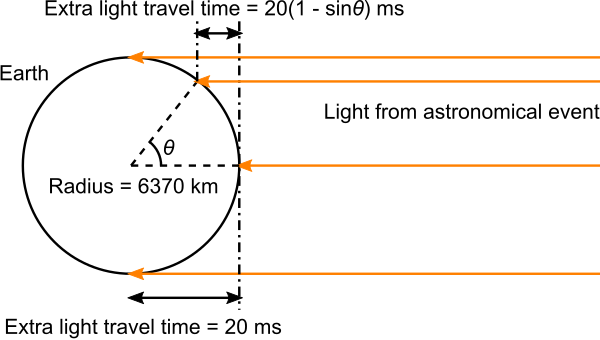
All of these corrections, which must be applied to astronomical observations where either (a) timings must be known to less than a second or (b) positions must be known accurately to determine orbits, are different by a light travel time of 21 ms for observers looking at objects directly overhead versus observers looking towards the horizon. And in between the light time corrections are 21 ms × (1 minus the sine of the observation zenith angle).

light time corrections on a spherical Earth

Diagram of light time corrections. Observation points where an astronomical event are on the horizon are 6370 km further away than observation points where the event is directly overhead.

This implies that places on Earth where an astronomical object appears near the horizon are a bit over 6000 km further away from the object than the location where the object is directly overhead. This is true no matter which object is observed, meaning it is independent of which position on Earth is directly under it. This cannot be so if the Earth is flat.

light time corrections on a flat Earth

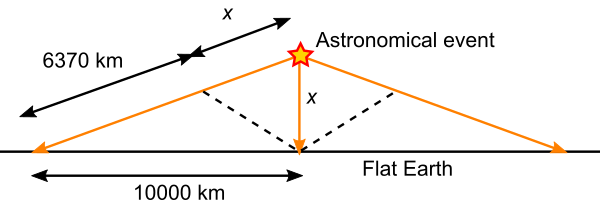
Geometry of light time corrections on a flat Earth.

Observation points on Earth where an astronomical event is overhead and on the horizon are separated by 10,000 km. If the Earth is flat, then the geometry must be something like that shown in the diagram above. The astronomical event is a distance x above the flat Earth, such that the distance from the event to a point 10,000 km along the surface is x plus the measured light travel time distance of 6370 km. Applying Pythagoras’s theorem:

(6370 + x)2 = 100002 + x2

Solving for x gives 4660 km. So measurements of light time correction imply that all astronomical events are 4660 km above the flat Earth. This means the elevation angle of the event seen from 10,000 km away is arctan(4660/10,000) = 25°, well above the horizon, which is inconsistent with observation (and the trigonometry of all the intermediate angles doesn’t work either). It’s also easy to show by other observations that astronomical objects are not all at the same distance – some are thousands, millions, or more times further away than others, and they are all much further away than 4660 km.

So the measurement of light time corrections imply that observers on Earth are positioned on the surface of a sphere. In other words, that the Earth is spherical in shape.

References:

[1] Rømer, O. (“A Demonstration Concerning the Motion of Light”.) Philosophical Transactions of the Royal Society, 12, p. 893-94, 1678. (Originally published in French as “Demonstration touchant le mouvement de la lumiere trouvé”. Journal des Sçavans, p. 276-279, 1677.) https://www.jstor.org/stable/101779

[2] Bastian, U. “The Time Coordinate Used in the Variable-star Community”. Information Bulletin on Variable Stars, No. 4822, #1, 2000. https://ui.adsabs.harvard.edu/abs/2000IBVS.4822….1B/abstract

[3] Dumoulin, C. “Unified Iterative Methods in Orbit Determination”. Celestial Mechanics and Dynamical Astronomy, 59, 1, p. 73-89, 1994. https://doi.org/10.1007/BF00691971

[4] Frühauf, M., Micheli, M., Santana-Ros, T., Jehn, R., Koschny, D., Torralba, O. R. “A systematic ranging technique for follow-ups of NEOs detected with the Flyeye telescope”. Proceedings of the 1st NEO and Debris Detection Conference, Darmstadt, 2019. https://ui.adsabs.harvard.edu/abs/2019arXiv190308419F/abstract