34. Earth’s internal heat

Opening disclaimer: I’m going to be talking about “heat” a lot in this one. Formally, “heat” is defined as a process of energy flow, and not as an amount of thermal energy in a body. However to people who aren’t experts in thermodynamics (i.e. nearly everyone), “heat” is commonly understood as an “amount of hotness” or “amount of thermal energy”. To avoid the linguistic awkwardness of using the five-syllable phrase “thermal energy” in every single instance, I’m just going to use this colloquial meaning of “heat”. Even some of the papers I cite use “heat” in this colloquial sense. I’ve already done it in the title, which to be technically correct should be the more awkward and less pithy “Earth’s internal thermal energy”.

The interior of the Earth is hot. Miners know first hand that as you go deeper into the Earth, the temperature increases. The deepest mine on Earth is the TauTona gold mine in South Africa, reaching 3.9 kilometres below sea level. At this depth, the rock temperature is 60°C, and considerable cooling technology is required to bring the air temperature down to a level where the miners can survive. The Kola Superdeep Borehole in Russia reached a depth of 12.2 km, where it found the temperature to be 180°C.

Lava, Hawaii

Lava—molten rock—emerging from the Earth in Hawaii. (Public domain image by the United States Geological Survey, from Wikimedia Commons.)

Deeper in the Earth, the temperature gets hot enough to melt rock. The results are visible in the lava that emerges from volcanic eruptions. How did the interior of the Earth get that hot? And exactly how hot is it down there?

For many years, geologists have been measuring the amount of thermal energy flowing out of the Earth, at thousands of measuring stations across the planet. A 2013 paper analyses some 38,374 heat flow measurements across the globe to produce a map of the mean heat flow out of the Earth, shown below[1]:

Mean heat flow out of the Earth

Mean heat flow out of the Earth in milliwatts per square metre, as a function of location. (Figure reproduced from [1].)

From the map, you can see that most of Earth’s heat emerges at the mid-ocean ridges, deep underwater. This makes sense, as this is where rising plumes of magma from deep within the mantle are acting to bring new rock material to the crust. The coolest areas are generally geologically stable regions in the middle of tectonic plates.

Hydrothermal vent

Subterranean material (and heat) emerging from a hydrothermal vent on Eifuku Seamount, Marianas Trench Marine National Monument. (Public domain image by the United States National Oceanic and Atmospheric Administration, from Wikimedia Commons.)

Although the heat flow out of the Earth’s surface is of the order of milliwatts per square metre, the surface has a lot of square metres. The overall heat flow out of the Earth comes to a total of around 47 terawatts[2]. In contrast, the sun emits close to 4×10¹⁴ terawatts of energy in total, and the solar energy falling on the Earth’s surface is 1360 watts per square metre, over 10,000 times as much as the heat energy leaking out of the Earth itself. So the sun dominates Earth’s heating and weather systems by roughly that factor.

So the Earth generates some 47 TW of thermal power. Where does this huge amount of energy come from? To answer that, we need to go all the way back to when the Earth was formed, some 4.5 billion years ago.

Our sun formed from the gaseous and dusty material distributed throughout the Galaxy. This material is not distributed evenly, and where there is a denser concentration, gravity acts to draw in more material. As the material is pulled in, any small motions are amplified into an overall rotation. The result is an accretion disc, with matter spiralling into a growing mass at the centre. When the central concentration accumulates enough mass, the pressure ignites nuclear reactions and a star is born. Some of the leftover material continues to orbit the new star and forms smaller accretions that eventually become planets or smaller bodies.

The process of accreting matter generates thermal energy. Gravitational potential energy reduces as matter pulls closer together, and the resulting collisions between matter particles convert it into thermal energy, heating up the accumulating mass. Our Earth was born hot. As the matter settled into a solid body, the shrinking further heated the core through the Kelvin-Helmholtz mechanism. The total heat energy from the initial formation of the Earth dissipates only very slowly into space, and that process is still going on today, 4.5 billion years later.

It’s not known precisely how much of this primordial heat is left in Earth or how much flows out, but various different studies suggest it is somewhere in the range of 12-30 TW, roughly a quarter to two-thirds of Earth’s total measured heat flux[3]. So that’s not the only source of the heat energy flowing out of the Earth.

The other source of Earth’s internal heat is radioactive decay. Some of the matter in the primordial gas and dust cloud that formed the sun and planets was produced in the supernova explosions of previous generations of stars. These explosions produce atoms of radioactively unstable isotopes. Many of these decay relatively rapidly and are essentially gone by now. But some isotopes have very long half-lives, most importantly: potassium-40 (1.25 billion years), thorium-232 (14.05 billion years), uranium-235 (703.8 million years), and uranium-238 (4.47 billion years). These isotopes still exist in significant quantities inside the Earth, where they continue to decay, releasing energy.

We have a way of probing how much radioactive energy is released inside the Earth. The decay reactions produce neutrinos (which we’ve met before), and because they travel unhindered through the Earth these can be detected by neutrino observatories. These geoneutrinos have energy ranges that distinguish them from cosmic neutrino sources, and of course always emerge from underground. The observed decay rates from geoneutrinos correspond to a total radiothermal energy production of 10-30 TW, of the same order as the primordial heat flux. (The neutrinos themselves also carry away part of the energy from the radioactive decays, roughly 5 TW, but this is an additional component not deposited as thermal energy inside the Earth.)

Mean heat flow out of the Earth

Approximate radiothermal energy generated within the Earth, plotted as a function of time, from the formation of the Earth 4.5 billion years ago, to the present. The four main isotopes are plotted separately, and the total is shown as the dashed line. (Public domain figure adapted from data in [4], from Wikimedia Commons.)

To within the uncertainties, the sum of the estimated primordial and measured radiothermal energy fluxes is equal to the total measured 47 TW flux. So that’s good.

Once you know how much heat is being generated inside the Earth, you can start to apply heat transfer equations, knowing the thermodynamic properties of rock and iron, how much conduction and convection can be expected, and cross-referencing it with our knowledge of the physical state of these materials under different temperature and pressure conditions. There’s also additional information about the internal structure of the Earth that we get from seismology, but that’s a story for a future article. Putting it all together, you end up with a linked series of equations which you can solve to determine the temperature profile of the Earth as a function of depth.

Mean heat flow out of the Earth

Temperature profile of the Earth’s interior, from the surface (left) to the centre of the core (right). Temperature units are not marked on the vertical axis, but the temperature of the surface (bottom left corner) is approximately 300 K, and the inner core (IC, right) is around 7000 K. UM is upper mantle, LM lower mantle, OC outer core. The calculated temperature profile is the solid line. The two solid dots are fixed points constrained by known phase transitions of rock and iron – the slopes of the curves between them are governed by the thermodynamic equations. The dashed lines are various components of the constraining equations. (Figure reproduced from [5].)

The results are all self-consistent, with observations such as the temperature of the rock in deep mine shafts and the rate of detection of geoneutrinos, with structural constraints provided by seismology, and with the temperature constraints and known modes of heat flow from the core to the surface of the Earth.

That is, they’re all consistent assuming the Earth is a spherical body of rock and iron. If the Earth were flat, the thermal transport equations would need to be changed to reflect the different geometry. As a first approximation, assume the flat Earth is relatively thin (i.e. a cylinder with the radius larger than the height). We still measure the same amount of heat flux emerging from the Earth’s surface, so the same amount of heat has to be either (a) generated inside it, or (b) being input from some external energy source underneath the flat Earth. However geoneutrino energy ranges indicate that they come from radioactive decay of Earthly minerals, so it makes sense to conclude that radiothermal heating is significant.

If radioactive decay is producing heat within the bulk of the flat Earth, then half of the produced neutrinos will emerge from the underside, and thus be undetectable. So the total heat production should be double that deduced from neutrino observations, or somewhere in the range 20-60 TW. To produce twice the energy, you need twice the mass of the Earth. If the flat Earth is a disc with radius 20,000 km (the distance from the North Pole to the South Pole), then to have the same volume as the spherical Earth it would need to be 859 km thick. But we need twice as much mass to produce the observed thermal energy flux, so it should be approximately 1720 km thick. Some fraction of the geoneutrinos will escape from the sides of the cylinder of this thickness, which means we need to add more rock to produce a bit more energy to compensate, so the final result will be a bit thicker.

There’s no obvious reason to suppose that a flat Earth can’t be a bit over 1700 km thick, as opposed to any other thickness. With over twice as much mass as our spherical Earth, the surface gravity of this thermodynamically correct flat Earth would be over 2 Gs (i.e. twice the gravity we experience), which is obviously wrong, but then many flat Earth models deny Newton’s law of gravity anyway (because it causes so many problems for the model).

But just as in the spherical Earth model the observed geoneutrino flux only accounts for roughly half the observed surface heat flux. The other half could potentially come from primordial heat left over from the flat Earth’s formation – although as we’ve already seen, what we know about planetary formation precludes the formation of a flat Earth in the first place. The other option is (b) that the missing half of the energy is coming from some source underneath the flat Earth, heating it like a hotplate. What this source of extra energy is is mysterious. No flat Earth model that I’ve seen addresses this problem, let alone proposes a solution.

What’s more, if such a source of energy under the flat Earth existed, then it would most likely also radiate into space around the edges of the flat Earth, and have observable effects on the objects in the sky above us. What we’re left with, if we trust the sciences of radioactive decay and thermal energy transfer, is a strong constraint on the thickness of the flat Earth, plus a mysterious unspecified energy source underneath – neither of which are mentioned in standard flat Earth models.

References:

[1] Davies, J. H. “Global map of solid Earth surface heat flow”. Geochemistry, Geophysics, Geosystems, 14(10), p.4608-4622, 2013. https://doi.org/10.1002/ggge.20271

[2] Davies, J.H., Davies, D.R. “Earth’s surface heat flux”. Solid Earth, 1(1), p.5-24, 2010. https://doi.org/10.5194/se-1-5-2010

[3] Dye, S.T. “Geoneutrinos and the radioactive power of the Earth”. Reviews of Geophysics, 50(3), 2012. https://doi.org/10.1029/2012RG000400

[4] Arevalo Jr, R., McDonough, W.F., Luong, M. “The K/U ratio of the silicate Earth: Insights into mantle composition, structure and thermal evolution”. Earth and Planetary Science Letters, 278(3-4), p.361-369, 2009. https://doi.org/10.1016/j.epsl.2008.12.023

[5] Boehler, R. “Melting temperature of the Earth’s mantle and core: Earth’s thermal structure”. Annual Review of Earth and Planetary Sciences, 24(1), p.15-40, 1996. https://doi.org/10.1146/annurev.earth.24.1.15

33. Angle sum of a triangle

Differential geometry is the field of mathematics dealing with the geometry of surfaces, such as planes, curved surfaces, and also higher dimensional curved spaces. It’s used extensively in physics to deal with the space curvatures caused by gravity in the theory of general relativity, and also has applications in several other fields of science and engineering. In its simplest form, differential geometry deals with the shapes and mathematical properties of what we intuitively think of as “surfaces” – for example, a sheet of paper, a draped cloth, the surface of a ball, or the curved surface shape of something like a saddle.

One of the most important properties of a surface is the curvature, or more specifically the Gaussian curvature. Intuitively, this is just a measure of how curved the surface is, although in some cases the answer isn’t quite as intuitive as you might think. Imagine a flat surface, like a polished table top, or a completely flat, unbent sheet of paper. Straightforwardly enough, a flat surface like this has a Gaussian curvature value of zero.

Carl Friedrich Gauss

Portrait of Carl Friedrich Gauss. (Public domain image from Wikimedia Commons.)

One of the most important results in differential geometry is the Theorema Egregium, which is Latin for “remarkable theorem”, proven by the 19th century German mathematician and physicist Carl Friedrich Gauss. The Theorema Egregium states that the Gaussian curvature of a surface does not change if the surface is bent without stretching it. So let’s take our flat sheet of paper and roll it up into a cylinder – we can do this without stretching or crumpling the paper. The resulting cylinder has the same curvature as the flat sheet, namely zero.

That might sound a bit strange, but it’s a result of the way that the Gaussian curvature of a surface is defined. A two-dimensional surface has two different directions that it can be curved in, and the two greatest amounts of curvature in different directions are called the principal curvatures. These measure how the surface bends by different amounts in different directions. Imagine drawing a straight line on a sheet of flat paper – the principal curvature in that direction is zero because the paper is flat. Now draw a line perpendicular to the first one – the principal curvature in that direction is also zero. The Gaussian curvature of the surface is the product of the two principal curvatures – in this case zero times zero.

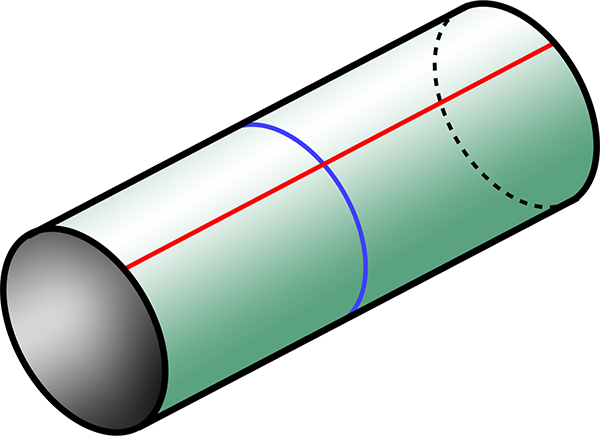
Now if we roll the paper into a cylinder, we can draw a line around the circular part, creating a circle like a hoop around a barrel. This is the maximum curvature of the cylinder, so one of the principal curvatures, and is non-zero. It’s defined as a positive number equal to 1 divided by the radius r of the cylinder. As the radius gets smaller, this principal curvature 1/r gets bigger. But a cylinder has a second principal curvature, perpendicular to the first one. This is along a line running the length of the cylinder parallel to the axis, and this line is perfectly straight – not curved at all. So it has a principal curvature of zero. And the Gaussian curvature of the cylindrical surface is the product (1/r)×0 = 0.

Cylinder

A cylinder, as could be formed by rolling a sheet of paper. The blue line is a line of maximum curvature, wrapped around the cylinder. The red line, along the cylinder perpendicular to the blue line, has zero curvature.

So what surfaces have non-zero Gaussian curvature? By the Theorema Egregium, they must be surfaces that you can’t bend a sheet of paper into without stretching it. An example is the surface of a sphere. If you try to wrap a sheet of paper smoothly around a sphere, you can’t do it without stretching, scrunching, or tearing the paper. If we draw a line around a sphere (like an equator), that’s one principal curvature, equal to 1/r, similar to the cylinder, where r is now the radius of the sphere. A line perpendicular to that (like a line of longitude), also has the same same principal curvature due to the symmetry of the sphere, 1/r. The Gaussian curvature of a sphere is then (1/r)×(1/r) = 1/r2.

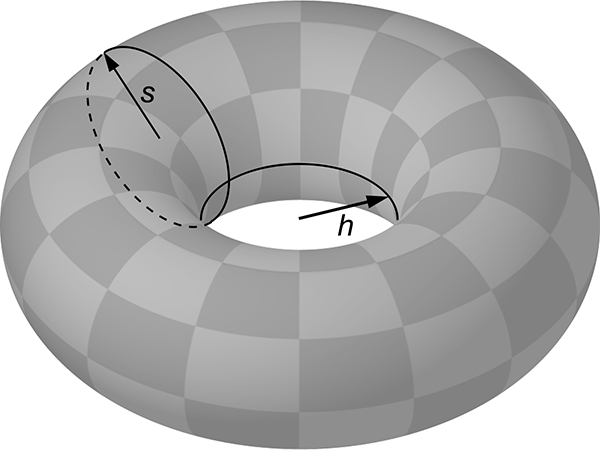
And then there are surfaces with a saddle shape, bending upwards in one direction and downwards in a perpendicular direction. An example is the surface on the inside of the hole in a torus (or doughnut shape). If you imagine standing on the surface here, in one direction it curves downwards with a radius s equal to that of the solid part of the torus, while in the perpendicular direction the surface curves upwards with radius h, the radius of the hole. Curving upwards is defined as a negative curvature, so the two principal curvatures are 1/s and -1/h, and the Gaussian curvature here is the product, -1/sh.

Torus showing radii

A torus, showing the solid radius s and the radius of the hole h. The point where the two circles intersect has Gaussian curvature -1/sh. (Image modified from public domain image from Wikimedia Commons.)

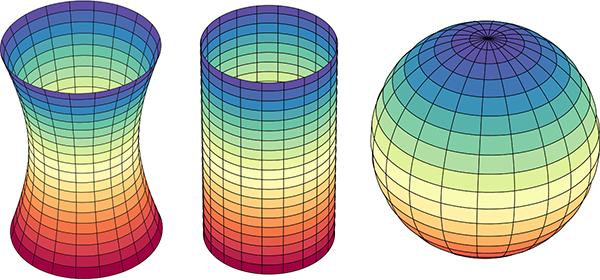
Here are examples of surfaces with negative, zero, and positive curvature, respectively a hyperboloid, cylinder, and sphere:

Surfaces with negative, zero, and positive curvatures

Illustration of surfaces with negative, zero, and positive Gaussian curvature: respectively a hyperboloid, cylinder, and sphere. (Image modified from public domain image from Wikimedia Commons.)

Another way to think about Gaussian curvature is to imagine wrapping a sheet of paper snugly onto the surface. If you can do it without stretching or tearing the paper (such as a cylinder), the curvature is zero. If you have to scrunch the paper up (like wrapping a sphere), the curvature is positive. If you have to stretch/tear the paper (like the saddle or hyperboloid), the curvature is negative. It’s also important to realise that the Gaussian curvature doesn’t need to be the same everywhere – it can vary across the surface. It’s zero at all points on a cylinder, and 1/r2 at all points on a sphere, but on a torus the curvature is negative on the inside of the hole and positive on the outside, with lines of zero curvature running around the top and bottom.

Torus showing positive and negative curvatures

Diagram of a torus, showing regions of positive (green) and negative (orange) Gaussian curvature. The boundary between the regions has zero curvature.

A property of two-dimensional curvature is that it affects the geometry of two-dimensional shapes on the surface. A surface with zero Gaussian curvature we call Euclidean, and the Euclidean geometry matches the familiar geometry we learn at primary and secondary school. This incudes all those properties of circles and triangles and parallel lines that you learnt. In particular, let’s talk about triangles. Triangles have three internal angles and, as we learnt in school, if you add up the sizes of the angles you get 180°. In the angular unit known as radians, 180° is equal to π radians. (To convert from degrees to radians, divide by 180 and multiply by π.)

So, in a Euclidean geometry, the angle sum of a triangle equals π radians. This is the case for triangles drawn on a flat sheet of paper, and it also holds if you wrap the paper around a cylinder. The triangle bends around the cylinder in the positive principal curvature direction, but its Gaussian curvature remains zero (because of the Theorema Egregium). And if you measure the angles and add them up, they still add up to π radians (i.e. 180°).

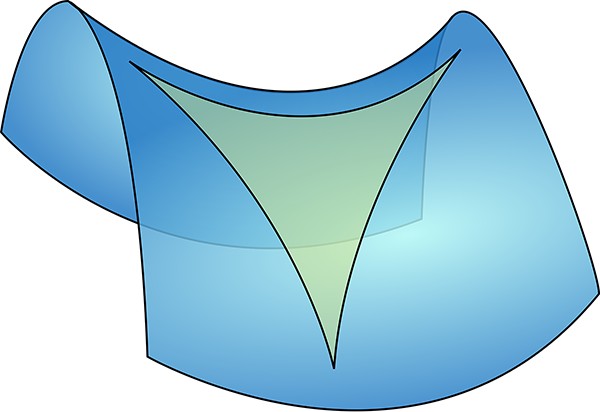
However if you draw a triangle on a surface of negative curvature, the lines are locally straight but from a three-dimensional point of view they are bowed inwards by the curvature of the surface, pinching the angles to make them smaller.

Saddle shaped surface with triangle

A saddle shaped surface with negative curvature, with a triangle drawn on it. The angles become pinched in and smaller. (Image modified from public domain image from Wikimedia Commons.)

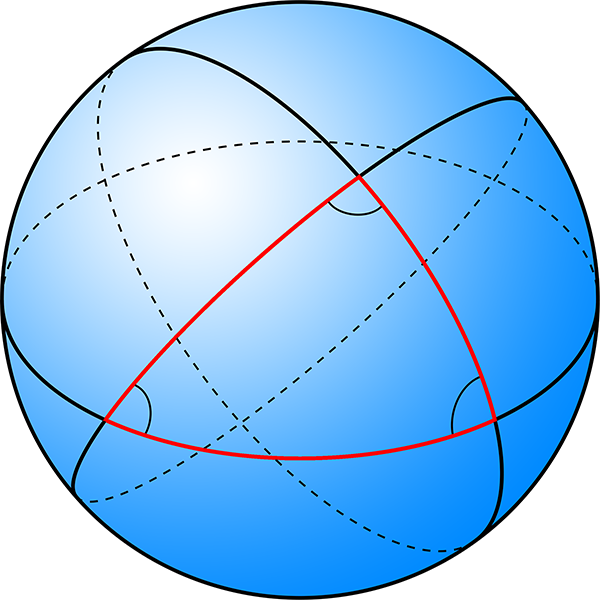
On the other hand, if you draw a triangle on the surface of a sphere, which has positive curvature, the lines seem to bow outwards, making the angles larger.

Spherical shaped surface with triangle

A spherical surface with positive curvature, with a triangle drawn on it. The angles become bulged out and larger. (Image modified from public domain image from Wikimedia Commons.)

Now, here’s the cool thing. On a negative curvature surface, the angle sum of a triangle is less than π radians, while on a positive curvature surface it’s greater than π radians. Imagine a really small triangle on either of these surfaces. Over a very small area, the curvature is not so evident, and the angle sum is only different from π radians by a small amount. But for a larger triangle, the curvature makes a bigger difference, and the angle sum differs from π radians by a larger amount. It turns out there’s a mathematical relationship between the Gaussian curvature of the surface, the size of the triangle, and the amount by which the angle sum differs from π radians:

The angle sum of a triangle = π radians + the integral of the Gaussian curvature over the area of the triangle. [Equation 1]

If you’re not familiar with calculus, the integral part basically means you take small patches of area within the triangle, multiply the Gaussian curvature in the patch by the area of the patch and add them all up. If the Gaussian curvature is constant (such as for a sphere), the integral is just equal to the curvature times the area of the triangle.

To take a concrete example, imagine a sphere of radius one unit. The surface area of the sphere is 4π square units. Now let’s draw a triangle on the sphere. If we imagine the sphere with lines of latitude and longitude like the Earth, we’ll take the equator as one of our triangle sides, and two lines of longitude running from the North Pole to the equator, 90° apart. The angle between the equator and any line of longitude is 90° (π/2 radians), and the angle at the North Pole between our chosen two lines of longitude is also 90° (by construction). So the angle sum of this triangle is 3π/2 radians, which is π/2 radians greater than π radians.

From equation 1, this means that the integral of the Gaussian curvature over the triangle equals π/2. The area of the triangle is one eighth the surface area of the whole sphere = 4π/8 = π/2 square units. The Gaussian curvature of a sphere is constant, so curvature×(π/2 square units) = π/2, which means the curvature is equal to 1. We said the sphere has a radius of one unit, and Gaussian curvature of a sphere is 1/r2, so the curvature is just 1. It all works out!

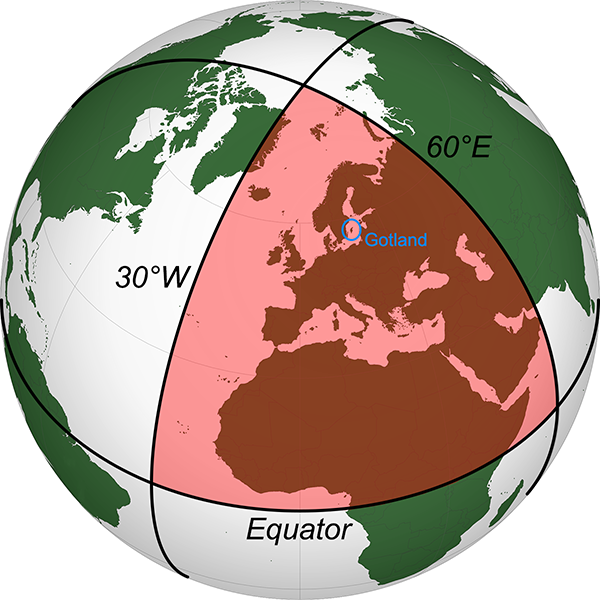
Now imagine we’re looking at such a triangle on the Earth itself. Our edges are the equator, and we’ll take the lines of longitude 30° west (running through eastern Greenland) and 60° east (through Russia and Kazakhstan, among other places). The area of this triangle, if we measured it, turns out to be 63.8 million square kilometres.

A large triangle on Earth

A triangle on Earth, with each angle equal to 90°. (Image modified from public domain image from Wikimedia Commons.)

Applying equation 1:

Angle sum of triangle = π radians + integral of Gaussian curvature over the area of the triangle

3π/2 radians = π radians + Gaussian curvature × 63.8 million square kilometres

π/2 radians = Gaussian curvature × 63.8 million square kilometres

Gaussian curvature = (π/2)/63.8×106

1/r2 = (π/2)/63.8×106

r2 = 63.8×10⁶/(π/2)

r = √[63.8×10⁶/(π/2)]

r = 6371 kilometres

This is the radius of the Earth. And it’s exactly right. So simply by measuring the angles of a triangle drawn on the surface of the Earth, and the area within that triangle, we can show that the surface of the Earth is not flat, but curved, and we can determine the radius of the Earth.

Obviously I haven’t gone out and measured such a triangle in practice. It would take expensive surveying gear and an extensive travel budget, but in principle you can certainly do it. Because the effect of the curvature depends on the size of the triangle, you need to survey a large enough area to detect the Earth’s curvature. How large?

I did some searching for angular accuracy of large scale surveys, but didn’t find anything particularly convincing. As a first estimate, I guessed conservatively that you might be able to measure the angles of a very large triangle to an accuracy of a tenth of a degree. With three corners, this makes the necessary deviation of the angle sum from π equal to 0.005 radians. The necessary area to see the effect of curvature is this number times the square of Earth’s radius, which gives 203,000 square kilometres, about the area of Belarus, or Kyrgyzstan. If you surveyed a triangle that big, measuring the area accurately and the angles to within 0.1° accuracy, you could experimentally verify that the Earth was curved, not flat.

A reference on the accuracy of Global Navigation Satellite Systems used for geodetic surveying [1], gives an angular accuracy better than my guess, in the order of 2 minutes of arc (i.e. 1/30°) for this method. This gives us a necessary area of 20,300 square kilometres, about the area of Slovenia or Israel. Another reference on laser scanners used in surveying [2] gives an angular resolution of 3 mm over a range of 100 m, equivalent to 6 seconds of arc. If we can survey the angles of a triangle this accurately, we only need to measure an area of 1220 square kilometres, which is smaller than the Indian Ocean island nation of Comoros, and about the size of Gotland, Sweden’s largest island (circled in blue in the above figure).

Interestingly, Gauss was likely inspired to develop a mathematical treatment of curvature by his experience as a surveyor. In the 1820s, he was tasked with surveying the Kingdom of Hanover (now part of Germany). To check the calibration of his equipment, he surveyed a large triangle with corners on the tops of the mountains Brocken, Hoher Hagen, and Großer Inselsberg, encompassing an area of 3000 km2. Each mountaintop had direct line of sight to the others, so this was not actually a survey of a curved triangle along the surface of the Earth, but rather a flat triangle through 3D space above the surface of the Earth. Gauss considered this a validation check on the accuracy of the equipment, rather than a test to see if the Earth was curved. He measured the angles and added them up, finding the sum to be 180° to within his measurement uncertainty. Although this was not the curvature experiment described above, Gauss later drew on his surveying experience to investigate the properties of curved surfaces.

This concludes the “Earth is a Globe” portion of this entry, but there are two other cool applications of differential geometry:

Firstly, curvature of this type applies not only to two-dimensional surfaces, but also to three-dimensional space. It’s possible that the 3D space we live in has a non-zero curvature. This sort of curvature is tied up in general relativity, gravity, and the expansion of the universe. We know the curvature of space is very close to zero, but not if it’s exactly zero – it may be slightly positive or negative. To measure the curvature of space directly, all we need to do is measure the angles of a large enough triangle. In this case, large enough means millions of light years. We can’t send surveyors out that far, but imagine if we contacted two alien civilisations by radio. It would take millions of years to coordinate, but we could ask them to measure the angles between our sun and the sun of the other civilisation at some predetermined time, and we could combine it with our own measurement, to determine the angle sum of this enormous triangle. If it doesn’t equal π radians, we’d have a direct measurement of the curvature of the universe.

Secondly, and perhaps more practically, the Theorema Egregium helps us eat pizza. If you take a long slice of pizza (and the base is not thick/crispy enough to be rigid), the tip can flop down messily.

A floppy slice of pizza

A slice of pizza flopping along its length. Danger of making a mess!

Differential geometry to the rescue! The slice begins flat, so has zero Gaussian curvature. It can bend in one direction, flopping down and making a mess. But if we fold the slice by pushing the ends of the crust upwards and together, this creates a non-zero principal curvature across the slice. By the Theorema Egregium, the Gaussian curvature (the product of the principal curvatures) must remain zero, so the principal curvature in the perpendicular direction along the slice is now fixed at zero, and the slice cannot flop down any more!

A rigid slice of pizza

A slice of pizza curved perpendicular to the length can no longer flop. Danger averted, thanks to differential geometry!

References:

[1] Correa-Muños, N. A., Cerón-Calderón, L. A. 2018. “Precision and accuracy of the static GNSS method for surveying networks used in Civil Engineering”. Ingeniería e Investigación, 38(1), p. 52-59, 2018. https://doi.org/10.15446/ing.investig.v38n1.64543

[2] Fröhlich, C. Mettenleiter, M. “Terrestrial laser scanning—new perspectives in 3D surveying”. International archives of photogrammetry, remote sensing and spatial information sciences, 36(8), p.W2, 2004. https://www.semanticscholar.org/paper/TERRESTRIAL-LASER-SCANNING-–-NEW-PERSPECTIVES-IN-3-Froehlich-Mettenleiter/4e117d837e43da8b9e281aec1ce9a8625430b6c3

32. Satellite laser ranging

Lasers are amazing things. However, when first invented, they were famously derided as “a solution looking for a problem”. The American physicist Theodore Maiman built the first laser in 1960, which is possibly earlier than you realised. This is because for several years nobody knew what to use them for, and there was no visible technology that made use of lasers. Their main use was as a device for science fiction, where authors imagined them being used as weapons.

This changed in the 1970s, when laser barcode scanners were invented. These essentially just use a laser as a narrow-beam source of light, which is scanned across the barcode using a rotating mirror. A light sensor detects the pattern of light and dark reflections from the barcode and circuitry turns that into digital data, which can then be processed by an attached computer, revealing information such as a product catalogue number. This is hardly a ground-breaking application; you can (and in fact manufacturers do) make barcode scanners using normal light sources as well.

The first consumer device to use lasers was the LaserDisc player in 1978, a home video format using technology that was the forerunner of the compact disc audio player released in 1982. These devices use precisely focused lasers to read tiny indentations on a reflective surface, turning them into data (analogue in the case of LaserDiscs, digital for CDs), in a way broadly similar to a barcode reader. However here the indentations are so small that doing the same with a normal light source would be prohibitively difficult. And so lasers finally found a widespread use.

Today lasers are used in so many applications and technologies that it would be difficult to imagine life without them. They are vital to modern optical fibre communications networks; have many uses in industry for cutting, welding, scanning, and manufacturing, including 3D printing; are used in many forms of surgery and cancer treatments; and have dozens of consumer uses from laser pointers to printers to entertainment.

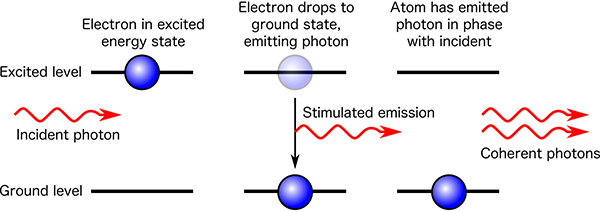
A laser is a device that emits light through a process known as stimulated emission. This occurs when a population of atoms exists in an excited energy state, meaning that the energy of one or more electrons in some of the atoms is not at the usual minimum energy state. In such a case, an electron can drop back down to the minimum energy state, emitting the excess energy as a photon of light; this is known as spontaneous emission. The stimulated emission part occurs when a photon interacts with another excited atom, triggering it to also drop into the minimum energy state and release a photon of the same energy. This stimulated photon is emitted in the same direction and with the same phase as the original photon (meaning the peaks and troughs of the light waves are in synch). As more emission is stimulated, an intense beam of light of a single wavelength, all travelling in the same direction is generated, known as a coherent beam.

Stimulated emission

Diagram of stimulated emission. The electron energy levels are within the confines of an atom (not shown).

Mechanically, this can be produced by using a transparent medium such as a gas or crystal, in a long cylinder shape surrounded by a bright strobe tube to supply the energy to excite the atoms. One end of the cylinder is a mirror, and the other end is a partly reflective mirror which lets some of the beam out. The light that emerges is a laser beam. Because the light is coherent, it doesn’t spread out like normal light, but travels in a tight line, illuminating only a small spot when it hits something. This means a laser beam is capable of travelling far greater distances than a normal light source of the same intensity, while still being bright enough to be observed.

Diagram of a laser

One of the very first applications for lasers was invented in 1961, but was restricted to industry and research for a decade. If you aim a brief laser pulse at something and time how long it takes for the reflection to come back, you can divide by the speed of light to calculate the distance to the object. This is called lidar, a portmanteau of “light” and “radar”, as it’s the same principle applied to light instead of radio waves. Lidar works to a range of several kilometres for detecting normal objects that partially reflect the incident beam.

But we can do a lot better if we construct a special target that reflects back virtually all of the incident beam. This can be done with a retroreflector. A common design is three flat mirrors arranged around a 90° corner, like the corner of a box. The combination of reflection off all three surfaces means that any incoming beam of light will be reflected back exactly towards its source, no matter what angle it comes in at. If you shine a laser at one of these, you can detect the return pulse over a much greater range. This form of lidar is known as laser ranging.

Retroreflector diagram

A corner retroreflector. No matter which direction incident light arrives from, the reflected beam returns in the same direction. (Public domain image from Wikimedia Commons.)

In 1964, NASA launched the Explorer 22 satellite into near-Earth orbit, about 1000 kilometres altitude. Its main mission was to perform science on the Earth’s ionosphere, but it was also equipped with a retroreflector, and was the first object in space to have its distance measured using satellite laser ranging.

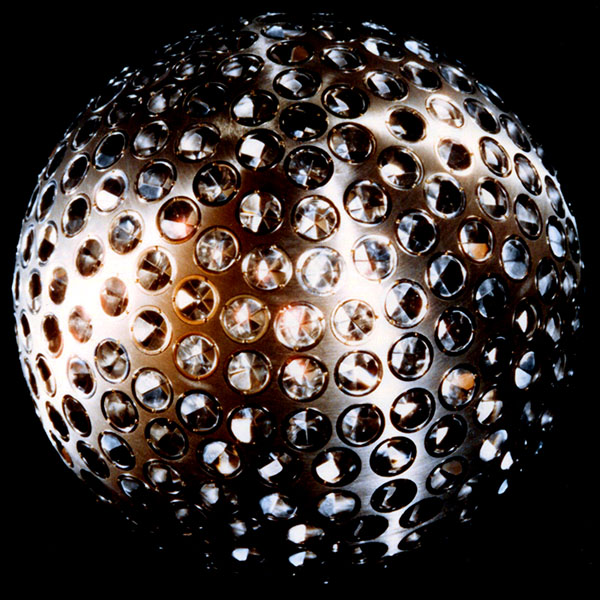
In 1976, NASA launched LAGEOS 1, a satellite designed specifically for laser ranging. LAGEOS has no active components, it is simply a brass sphere, coated in aluminium, with 426 retroreflectors embedded in the surface, so that no matter which way the satellite tumbles, dozens of reflectors are always oriented towards Earth.

LAGEOS 1 model

Model of LAGEOS 1 satellite. (Public domain image by NASA, from nasa.gov.)

LAGEOS 1 is in medium-Earth orbit, at an altitude of nearly 6000 km. This orbit is far from any perturbing influences and so is extremely stable, meaning the satellite’s position at any time can be calculated to a small fraction of a millimetre. This makes it a useful reference point for measuring the distances to stations on the Earth’s surface, by aiming lasers at the satellite and timing the reflected signal.

Laser ranging from an observatory

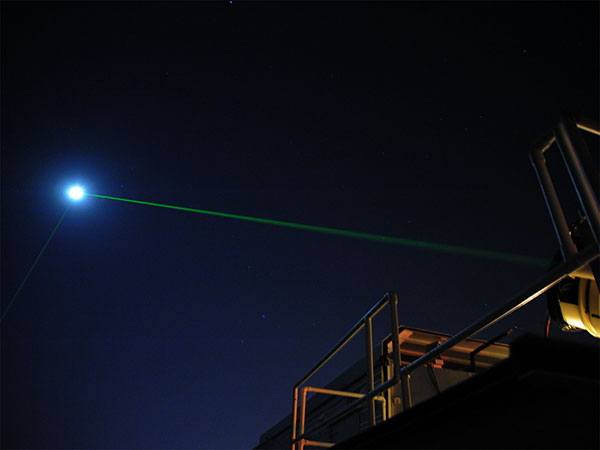
Satellite laser ranging in action. Laser Ranging Facility at the Geophysical and Astronomical Observatory at NASA’s Goddard Spaceflight Center. The lasers are aimed at the Lunar Reconnaissance Orbiter, in orbit around the moon. (Public domain image by NASA from Wikimedia Commons.)

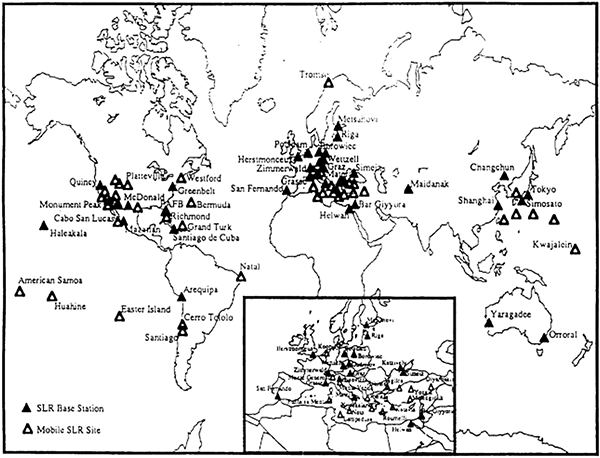
These measurements are so precise that they give the distance from the ground station to the satellite to an uncertainty of less than one millimetre. By using a reference point located away from Earth, this provides a method of checking motions of the Earth caused by weather systems, earthquakes, isostatic rebound (the slow rising of land in the millennia after glacial ice sheets melted), and tectonic drift. For example, geophysical tectonic modelling suggests that the Hawaiian Islands should be drifting northwards at approximately 70 mm per year. Measurement of the position of the Haleakala laser base station in Hawaii using LAGEOS and similar satellites shows this to be the case.

Laser ranging stations worldwide

Satellite laser ranging stations around the world. (Figure reproduced from [1].)

Laser ranging can also be (and is) used to measure the shape of the Earth. More specifically, it’s used to measure the shape of the geoid, which is the shape that corresponds to mean sea level (averaging out tides and weather) all over the Earth. More formally this is defined as the surface where the Earth’s gravitational field strength is identical to that at sea level. In areas of land, this surface is generally under the ground. The geoid is not perfectly spherical due to the uneven distribution of mass in the Earth. We’ve mentioned a few times that the Earth is approximately an ellipsoid due to the rotational force flattening the poles and causing a bulge at the equator. The geoid is almost an ellipsoid, but varies locally by up to approximately ±100 metres.

Diagram of the geoid

The geoid surface relative to an ellipsoid, shown as highly exaggerated relief. The darkest blue area below India is -106 m, while the red area near Iceland is +85 m. (Creative Commons Attribution 4.0 International image by the International Centre for Global Earth Models, from Wikimedia Commons.)

Besides LAGEOS 1 and 2, there are a handful of other similar retroreflector satellites. And there are also retroreflectors on the moon. Astronauts on NASA’s Apollo 11, 14, and 15 missions set up retroreflector arrays on the moon’s surface, and the unmanned Russian probes Lunakhod 1 and 2 also have retroreflectors.

Retroreflector on the moon

Retroreflector array set up on the lunar surface by Neil Armstrong and Buzz Aldrin during the Apollo 11 mission. (Public domain image by NASA from Wikimedia Commons.)

Since 1969, several lunar laser ranging experiments have been ongoing, making regular measurements of the distance between the Earth stations and the reflectors on the moon. These measurements can also determine the distance to better than one millimetre.

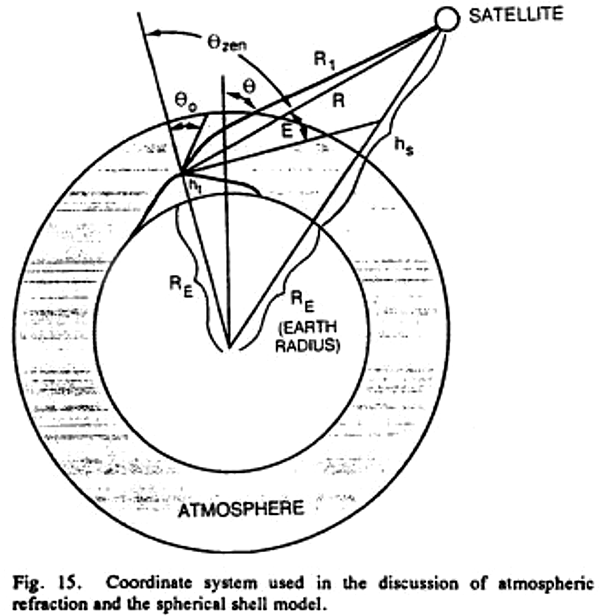
If you measure the distances from either an artificial satellite or the moon to different points on the Earth’s surface, it’s trivial to show that the points don’t lie even approximately on a flat plane, but that they lie on the surface of an approximately spherical body with the radius of the Earth. Finding an explicit statement such as “This demonstrates that the Earth is not flat, but spherical” in a published scientific article is difficult (because that result is neither surprising nor groundbreaking), but the following diagram shows the model that laser ranging scientists use to correct for effects such as atmospheric refraction, to enable them to get their measurements accurate down to a millimetre.

Model of Earth used for accurate laser ranging

Atmospheric refraction model used by laser ranging scientists. (Figure reproduced from [1].)

This shows clearly that laser ranging scientists—who have explicit and direct measurements of the shape of the Earth’s surface—assume the Earth is spherical in order to refine their calculations. They’d hardly do that if the Earth were flat.

References:

[1] Degnan, J. J. “Millimeter accuracy satellite laser ranging: a review”. Contributions of Space Geodesy to Geodynamics: Technology, 25, p.133-162, 1993. https://doi.org/10.1029/GD025p0133

[2] Murphy Jr., T. W. “Lunar Laser Ranging: The Millimeter Challenge”. Reports on Progress in Physics, 76(7), p. 076901, 2013. https://doi.org/10.1088/0034-4885/76/7/076901